Trading Signal for USD/JPY for March 28 - 29, 2023: sell below 131.25 (4/8 Murray - bearish channel)
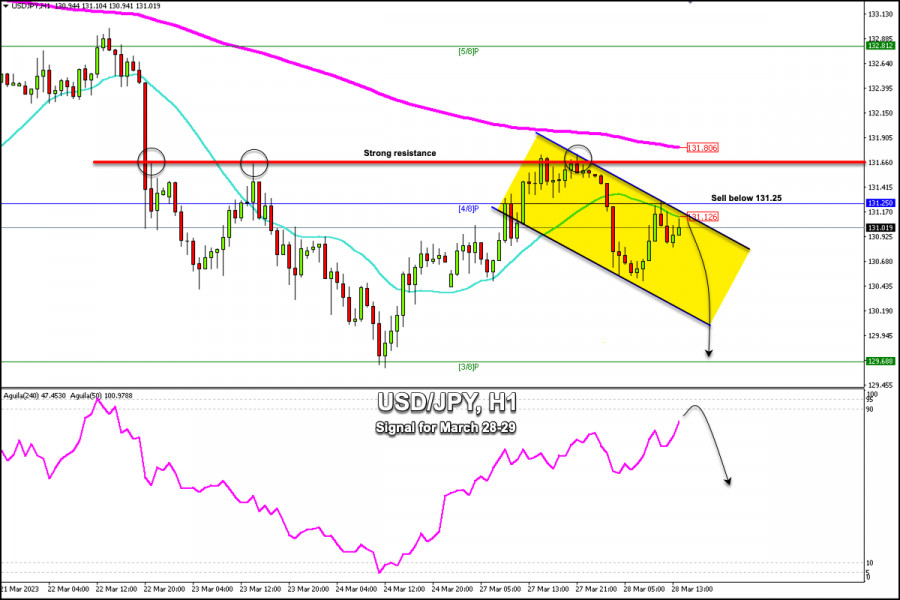
Early in the US session, the Japanese Yen is trading around 131.01, making a retracement after reaching a high of around 131.28, the level which coincides with 3/8 Murray (131.25).
In case the Yen trades below 131.25 (4/8 Murray) and below the 21 SMA, it could reach the bottom of 3/8 Murray around 129.68.
A sharp break of the downtrend channel formed since March 27 could be a sign of a trend reversal and the yen could climb above the 200 EMA located at 131.80 and finally hit 5/8 of Murray located at 132.81.
On the other hand, in case the USD/JPY pair falls and rebounds back to the 129.68 zone, it will be considered a signal to buy with targets at 131.25 (4/8 Murray) and 131.80 (200 EMA).
Below 131.25, the Yen could extend its strength and quickly reach the psychological level of 130.00 and finally reach 3/8 Murray located at 129.68.
Our trading plan for the next few hours is to sell at current price levels around 131.09 or in case of a pullback at 131.25, with targets at 130.15 (bottom bearish channel) and 129.69 (3/8 Murray). The eagle indicator has been giving an overbought signal which supports our short strategy.
Trading analysis offered by Flex EA.
Source #Unknown
Comments
Post a Comment