
Technical analysis on Gold for March 20th, 2023.

#

analytics64187cbf41408.jpg

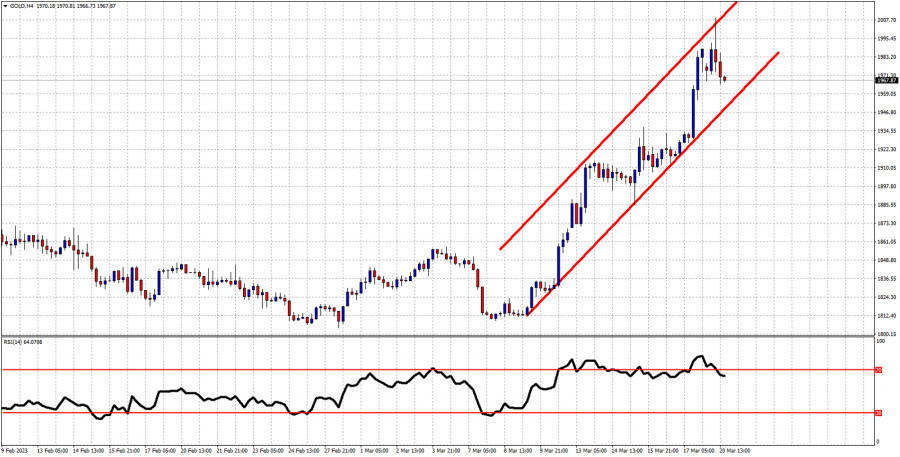
Red lines- bullish channel

Gold price is trading around $1,969. After briefly reaching as high as $2,009 Gold price has started to turn around. Price continues making higher highs and higher lows. Price remains inside the upward sloping channel. Trend remains bullish. As long as price remains inside the short-term bullish channel, trend will remain bullish. At $1,950 we find the lower channel boundary. This is key short-term support. The RSI has started turning lower from overbought levels. A pull back towards the lower channel boundary is the most probable scenario for the near term.


Trading analysis offered by Flex EA.
Source #Unknown

Comments

Popular posts from this blog

GBPUSD up and down. Back down testing 61.8% and swing area.

# GBPUSD tests 61.8% and swing area The GBPUSD is in an up and down day. The    GBPUSD  moved higher earlier. That move was helped by better than expected retail sales. However the high price today stalled near the high price from last week near 1.3643, and rotated back lower on the USD buying. The subsequent move lower now has the price back toward the 61.8% retracement along with a swing area between 1.35969 and 1.36034. As I type, the price has dipped below that swing area. What next? If the price can stay below the 1.36034 area, that would be the best case scenario for the sellers with the next major targets coming in at the 100 hour moving average 1.3569 (blue line), and the 200 hour moving average at 1.35609 (green line). The 50% midpoint of the 2022 trading range is just below those levels at 1.35526 and would be a another target on further weakness. A move back above 1.36034 with momentum would have traders looking again toward 1.3618 to 1.36271 and then t...