
Risk off for the EUROPEAN indices after the Credit Suisse woes.

#

Major European indices are turning around from a multiweek bullish run to an ugly reversal. Pull backs or trend reversals to the downside are usually more aggressive and we are now witnessing such a bearish change in the major indices. Yesterday we talked extensively about DAX (German index), while today we start by taking a closer look at the EUROSTOXX50 with the help of the Ichimoku cloud indicator.

analytics64131b46c42e1.jpg

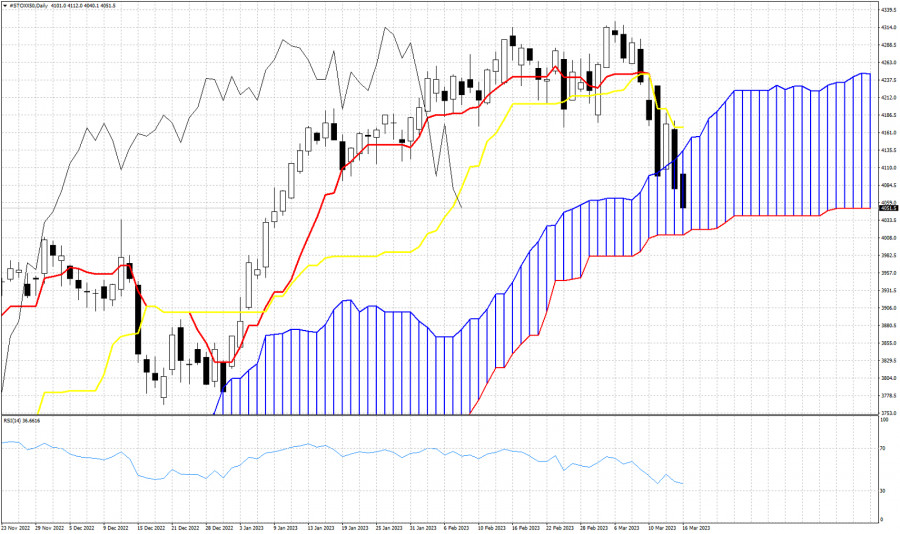
In Ichimoku cloud terms trend is now neutral as price has enter the Kumo (cloud). Price is below the negatively sloped tenkan-sen (red line indicator) and the kijun-sen (yellow line indicator). The Chikou span (black line indicator) is also now below the candlestick pattern. All the above characteristics are of a bearish trend. If these characteristics are combined with a break below the Kumo, then we will get a sell signal.

analytics64131bed4510c.jpg

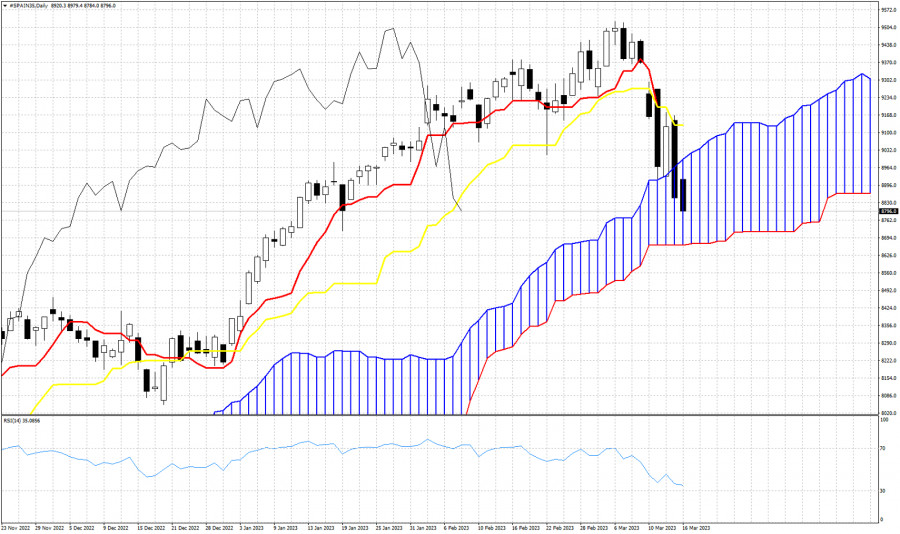
The Spanish IBEX is no different. Price is now in Neutral trend. Price is vulnerable to more downside towards the lower cloud boundary around 4,011. Recapturing the 4,170 level is important for bulls. They need to push price above this level in order to regain control.

analytics64131c68ca705.jpg


Trading analysis offered by Flex EA.
Source #Unknown

Comments

Popular posts from this blog

GBPUSD up and down. Back down testing 61.8% and swing area.

# GBPUSD tests 61.8% and swing area The GBPUSD is in an up and down day. The    GBPUSD  moved higher earlier. That move was helped by better than expected retail sales. However the high price today stalled near the high price from last week near 1.3643, and rotated back lower on the USD buying. The subsequent move lower now has the price back toward the 61.8% retracement along with a swing area between 1.35969 and 1.36034. As I type, the price has dipped below that swing area. What next? If the price can stay below the 1.36034 area, that would be the best case scenario for the sellers with the next major targets coming in at the 100 hour moving average 1.3569 (blue line), and the 200 hour moving average at 1.35609 (green line). The 50% midpoint of the 2022 trading range is just below those levels at 1.35526 and would be a another target on further weakness. A move back above 1.36034 with momentum would have traders looking again toward 1.3618 to 1.36271 and then t...