Trading signal for GOLD (XAU/USD) on February 16-17, 2023: buy above $1,830 (21 SMA - strong support)
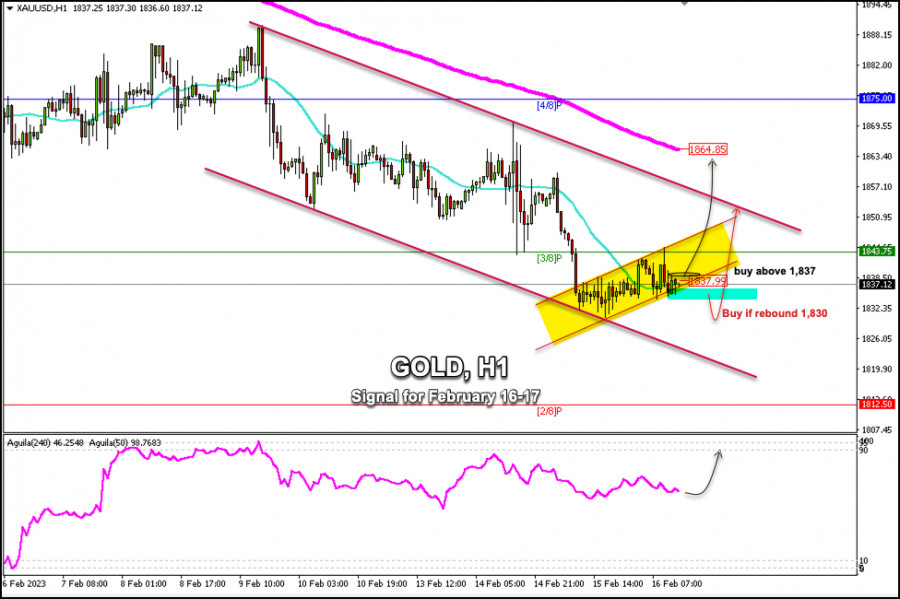
Early in the American session, GOLD (XAU/USD) is trading around 1,837 above the 21 SMA. The metal is showing some strength, but there is bearish pressure. So, it is likely that a fall could occur again.
Gold reached a low of 1,830 yesterday and has been bouncing since. If it consolidates above 1,840, there could be a rally and the price could reach the 200 EMA located at 1,864.
USDX is technically correcting from the 6-week highs reached on Wednesday and US Treasury yields are falling as a consequence. In case this scenario of technical correction of the dollar continues, it could be favorable for gold. Hence, the metal could recover and reach 1,865 in the next few hours.
According to the 1-hour chart, we can see a downtrend channel formed since February 9. In case gold trades below 1,930, we would expect it to reach the bottom of this channel at around 1,815.
On the other hand, the area of 1,850 (bearish channel top) - 1,875 (4/8 Murray) could act as an immediate obstacle. A technical bounce towards this zone could be seen as an opportunity to sell.
Our trading plan is to buy gold above 1,830 or in case of consolidation above 1,837 with targets at 1,853 at 1,864.
Trading analysis offered by Flex EA.
Source #Unknown
Comments
Post a Comment