
Ichimoku cloud indicator analysis on Oil for February 17th, 2023.

#

analytics63ef84290184f.jpg

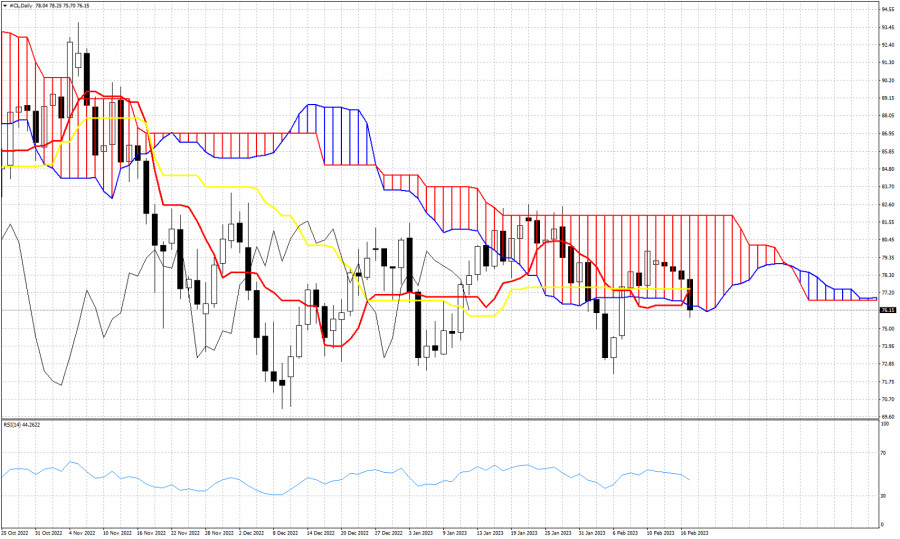
Oil price is trading around $76 and is very close to providing a new bearish signal. Price was trading inside the Kumo (cloud) for the last 8 sessions. Bulls were unable to break above the cloud resistance. Price is now trading below both the tenkan-sen (red line indicator) and the kijun-sen (yellow line indicator). The tenkan-sen and kijun-sen provide resistance is at $77.50. A daily close below the Kumo (cloud) would be a bearish sign. Bulls need to re-enter the cloud, otherwise price will remain vulnerable to more downside.


Trading analysis offered by Flex EA.
Source #Unknown

Comments

Popular posts from this blog

GBPUSD up and down. Back down testing 61.8% and swing area.

# GBPUSD tests 61.8% and swing area The GBPUSD is in an up and down day. The    GBPUSD  moved higher earlier. That move was helped by better than expected retail sales. However the high price today stalled near the high price from last week near 1.3643, and rotated back lower on the USD buying. The subsequent move lower now has the price back toward the 61.8% retracement along with a swing area between 1.35969 and 1.36034. As I type, the price has dipped below that swing area. What next? If the price can stay below the 1.36034 area, that would be the best case scenario for the sellers with the next major targets coming in at the 100 hour moving average 1.3569 (blue line), and the 200 hour moving average at 1.35609 (green line). The 50% midpoint of the 2022 trading range is just below those levels at 1.35526 and would be a another target on further weakness. A move back above 1.36034 with momentum would have traders looking again toward 1.3618 to 1.36271 and then t...