
Bitcoin accumulates more bullish energy

#

BTC/USD is trading at 24,598 at the time of writing below today's high of 25,250. Technically, the price action signaled exhausted buyers in the short term after reaching a major resistance.

Bitcoin increased by 18.12% from last week's low of 21,374 to 25,250 today's high. The bias is bullish despite temporary retreats or sideways movements. In the last 7 days, BTC/USD is up by 13.50% but it's down by 1.03% in the last 24 hours.

BTC/USD Rally Stopped By 25,250!

analytics63f4e890b47fe.jpg

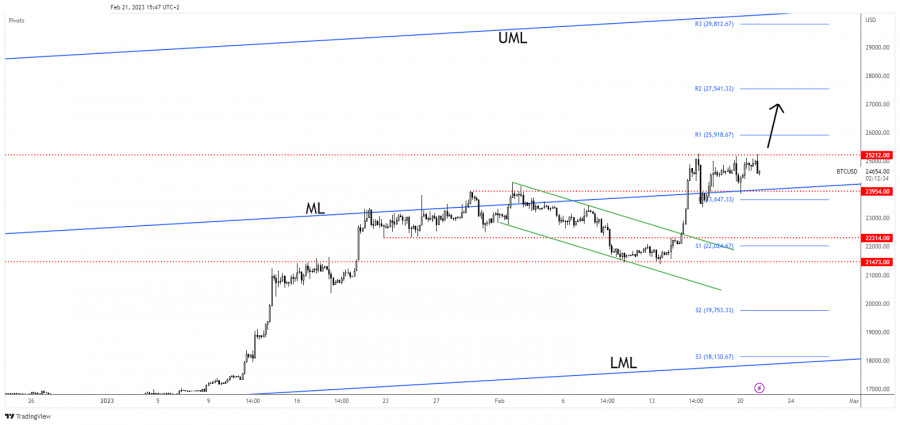
BTC/USD tested and retested the 25,212 historical level (key level), registering only false breakouts. It seems that we have a strong supply zone around it. Technically, the median line (ml) of the ascending pitchfork represents a downside obstacle.

As long as it stays above it, the rate could extend its growth. The current sideways movement could represent an accumulation. The price tries to attract more buyers before extending its growth.

BTC/USD Outlook!

A valid breakout above 25,212 activates further growth. This is seen as a long opportunity.


Trading analysis offered by Flex EA.
Source #Unknown

Comments

Popular posts from this blog

GBPUSD up and down. Back down testing 61.8% and swing area.

# GBPUSD tests 61.8% and swing area The GBPUSD is in an up and down day. The    GBPUSD  moved higher earlier. That move was helped by better than expected retail sales. However the high price today stalled near the high price from last week near 1.3643, and rotated back lower on the USD buying. The subsequent move lower now has the price back toward the 61.8% retracement along with a swing area between 1.35969 and 1.36034. As I type, the price has dipped below that swing area. What next? If the price can stay below the 1.36034 area, that would be the best case scenario for the sellers with the next major targets coming in at the 100 hour moving average 1.3569 (blue line), and the 200 hour moving average at 1.35609 (green line). The 50% midpoint of the 2022 trading range is just below those levels at 1.35526 and would be a another target on further weakness. A move back above 1.36034 with momentum would have traders looking again toward 1.3618 to 1.36271 and then t...