
Weekly analysis on the stock price of Ford Motors for week ending January 20th, 2023.

#

analytics63cabb35c4604.jpg

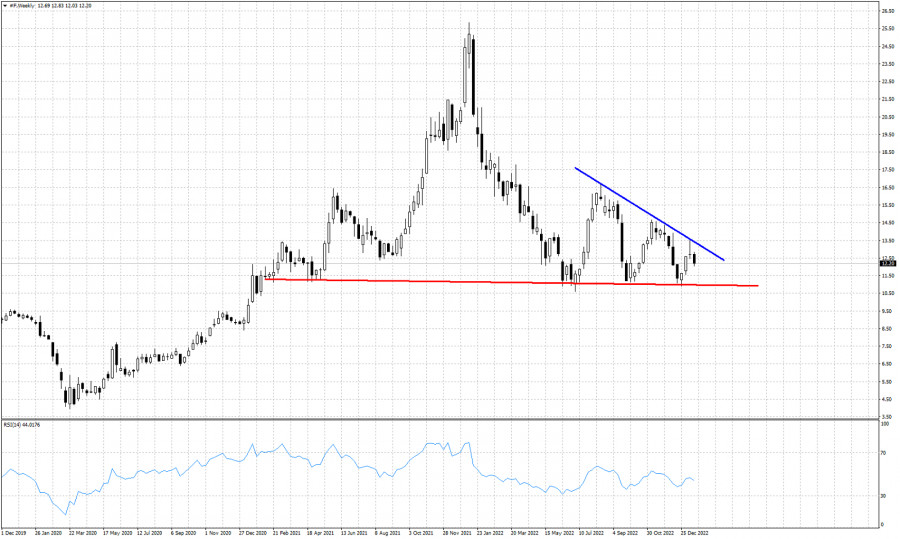
Blue line- resistance

Red line -support

In our previous posts on Ford stock price we have succeeded in forecasting the decline towards $11 after the rejection at the $14.50 resistance area and we also forecasted the bounce towards the trend line at $13.50-13.80. Price once again shows rejection signs. Last week's candle was bearish because of the long upper tail. Price also got rejected at the trend line resistance and this week price is making new lower lows relative to the previous week. Price action suggests that Ford stock price should continue lower towards the major horizontal support of $11. As long as price is below the blue downward sloping resistance trend line, price will be vulnerable to producing a new bearish signal by breaking below $11.


Trading analysis offered by Flex EA.
Source #Unknown

Comments

Popular posts from this blog

GBPUSD up and down. Back down testing 61.8% and swing area.

# GBPUSD tests 61.8% and swing area The GBPUSD is in an up and down day. The    GBPUSD  moved higher earlier. That move was helped by better than expected retail sales. However the high price today stalled near the high price from last week near 1.3643, and rotated back lower on the USD buying. The subsequent move lower now has the price back toward the 61.8% retracement along with a swing area between 1.35969 and 1.36034. As I type, the price has dipped below that swing area. What next? If the price can stay below the 1.36034 area, that would be the best case scenario for the sellers with the next major targets coming in at the 100 hour moving average 1.3569 (blue line), and the 200 hour moving average at 1.35609 (green line). The 50% midpoint of the 2022 trading range is just below those levels at 1.35526 and would be a another target on further weakness. A move back above 1.36034 with momentum would have traders looking again toward 1.3618 to 1.36271 and then t...