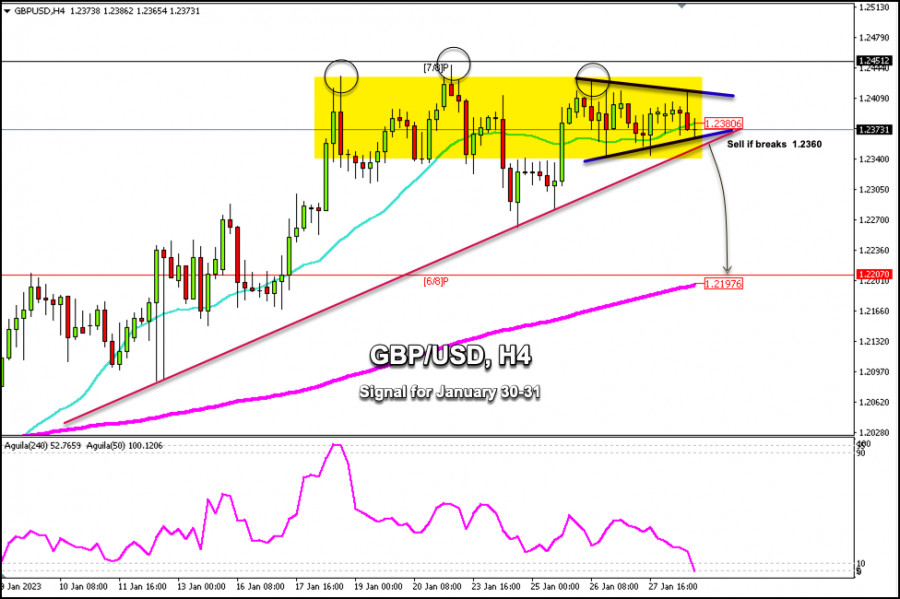
Trading Signal for GBP/USD for January 30 - 31, 2023: sell if it breaks 1.2360 (21 SMA - symmetrical triangle)
Early in the American session, the British pound is trading around 1.2373 below the 21 SMA and within the downtrend channel formed since January 9.
We can see that the British pound is consolidating in a symmetrical triangle pattern. If GBP/USD pair breaks this technical pattern in the next few hours, we could expect it to continue falling, but to do so, the instrument will have to break the bearish channel sharply and consolidate below 1.2360.
In case the British pound falls and trades below the 21 SMA located at 1.2381, there is a strong probability that it could fall and reach the strong support around 1.2207 (6/8 Murray) and finally reach the 200 EMA located at 1.2197.
Our trading plan for the next few hours is to sell the British pound if it consolidates below 1.2360 with targets at 1.2305 and 1.2207(6/8 Murray). In case GBP/USD consolidates above 1.2415 on the 4-hour chart, it will be a clear signal to buy with targets at 1.2451(7/8 Murray) and 1.2500.
The eagle indicator is showing an extreme oversold signal. In the event that the GBP/USD pair falls and a technical correction occurs, it could resume its bullish cycle. The key point could be the 6/8 Murray zone, a level that converges with the 200 EMA around 1.22.
Trading analysis offered by Flex EA.
Source #Unknown
Comments
Post a Comment