
Short-term technical analysis on EURUSD for January 23rd, 2023.

#

analytics63ceac60429b5.jpg

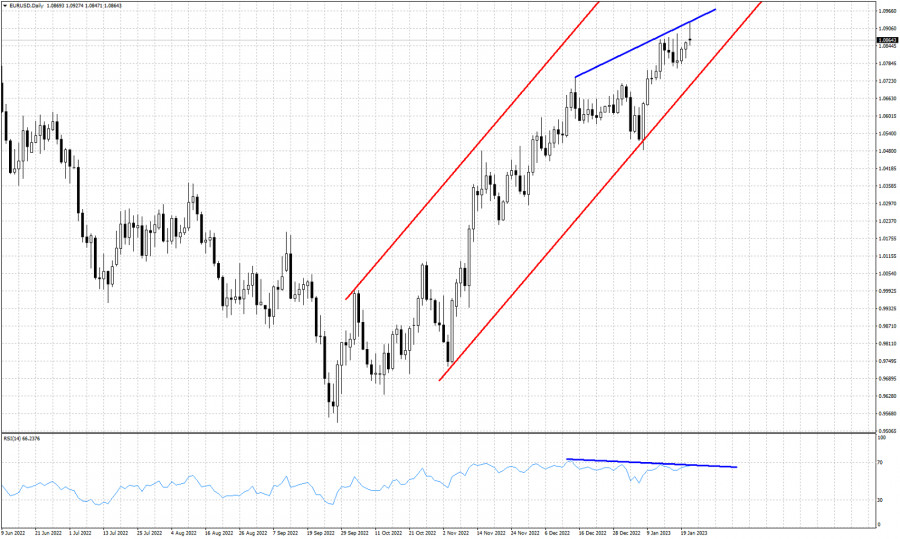
Red lines- bullish channel

Blue lines- bearish RSI divergence

EURUSD is making new multi month highs above 1.09.The week started on a positive note but as time passes, selling pressures have brought the pair back near the open prices of the week. The long upper tail in the Daily candlestick combined with the bearish RSI divergence are an important warning. Technically trend remains bullish as price is still making higher highs and higher lows inside the red upward sloping channel. Short-term support is found at 1.0767 recent low. The bearish RSI divergence is an important warning for bulls but not a reversal signal. Channel support is found at 1.0720.


Trading analysis offered by Flex EA.
Source #Unknown

Comments

Popular posts from this blog

GBPUSD up and down. Back down testing 61.8% and swing area.

# GBPUSD tests 61.8% and swing area The GBPUSD is in an up and down day. The    GBPUSD  moved higher earlier. That move was helped by better than expected retail sales. However the high price today stalled near the high price from last week near 1.3643, and rotated back lower on the USD buying. The subsequent move lower now has the price back toward the 61.8% retracement along with a swing area between 1.35969 and 1.36034. As I type, the price has dipped below that swing area. What next? If the price can stay below the 1.36034 area, that would be the best case scenario for the sellers with the next major targets coming in at the 100 hour moving average 1.3569 (blue line), and the 200 hour moving average at 1.35609 (green line). The 50% midpoint of the 2022 trading range is just below those levels at 1.35526 and would be a another target on further weakness. A move back above 1.36034 with momentum would have traders looking again toward 1.3618 to 1.36271 and then t...