Trading Signal for GOLD (XAU/USD) for December 20 - 21, 2022: sell in case of pullback at $1,820 - $1,825 (6/8 Murray - uptrend
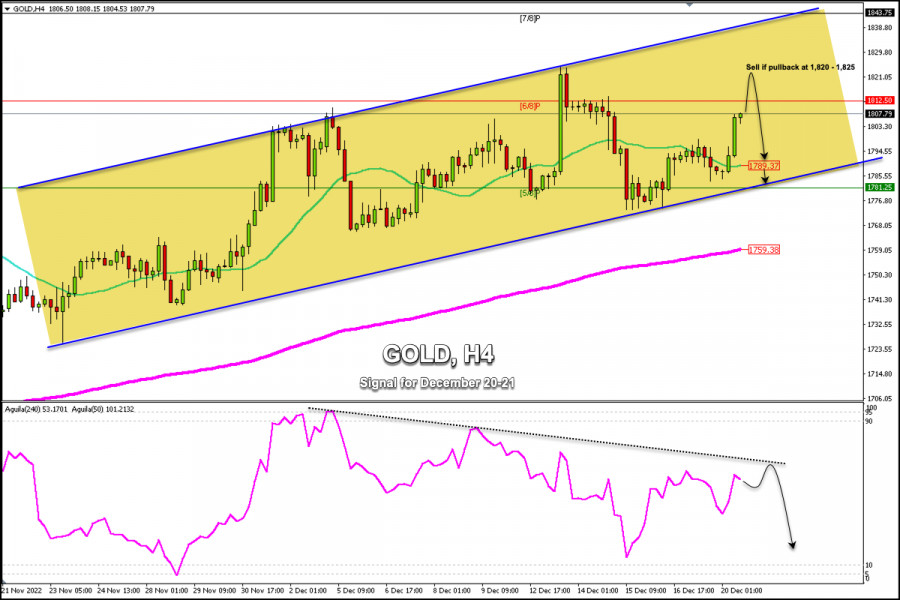
Early in the American session, Gold (XAU/USD) is trading around 1,807.79 above the 21 SMA and below the 6/8 Murray.
According to the 4-hour chart, we can see a bullish bias. The metal is unaffected by resistance and it is likely to reach the zone of 1,812 (6/8 Murray) and 1,820 -1,825 (maximum of December 13), just in case the uptrend continues.
In case gold reaches the area of 1,810 -1,812 and breaks sharply above this level, it will be seen as an opportunity to buy with targets at 1,820 and 1,825.
Alternatively, in case gold reaches the daily resistance zone (R_3) between 1,820 and 1,825, it will be considered an opportunity to sell with targets at 1,812 and 1,789.
It is expected that during these days of festivities, the market will trade with low liquidity. Therefore, we should be braced for sudden twists in the price of gold. So, we could expect strong upward or downward movements. Hence, we must be very careful.
Our trading plan for the next few hours is to sell gold only in case there is a pullback towards the 1,820 -1,825 zone, with targets at 1,812 and at the psychological level of 1,800. The eagle indicator is below a strong resistance and any technical bounce in gold will be seen as an opportunity to sell.
Trading analysis offered by Flex EA.
Source #Unknown
Comments
Post a Comment