Early in the American session, the British Pound (GBP/USD) was trading around 1.2036 bouncing after having reached the 200 EMA located at 1.2017. It is expected that in the next few hours, it will continue to bounce and could reach the zone of 1.2070 and even the 1.2124 weekly maximum.
A daily close below the 200 EMA could signify a bearish continuation and the price could reach 5/8 Murray at 1.1962. It is a key level as below this zone, the British pound could trigger a bearish acceleration and reach 4/8 Murray at 1.1718.
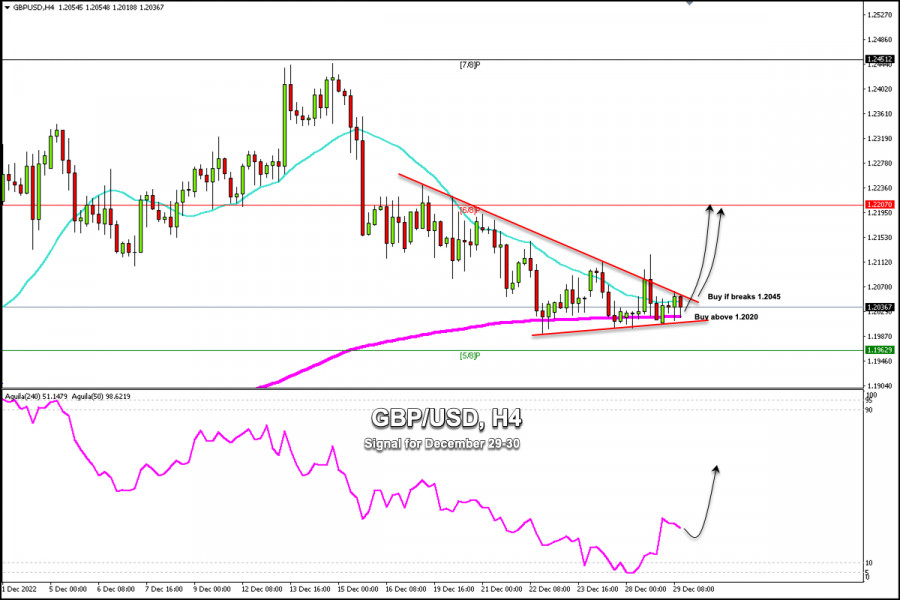
According to the 4-hour chart, we can see that the eagle indicator is giving a positive signal. Supported by our technical tool we could conclude that any rebound toward the 1.2000 zone will be considered an opportunity to buy.
The GBP/USD technical outlook suggests that buyers remain hesitant to take large trading volumes. A daily close above 1.2050 could mean an advance in the recovery of the British pound and it could approach the resistance of 1.2207 (6/8 Murray) in the coming days.
In case the pair stabilizes above 1.2045 (21 SMA and bearish channel top) and this level is established as support, it could target 1.2094 which represents the weekly pivot point. A close above this level on 4-hour charts could launch a new bullish sequence and open the door to a prolonged bounce towards 1.2170 (R_2 daily) and up to 1.2207 (6/8Murray).
Our trading plan for the next few hours is to buy the British pound above 1.2020 with targets of 1.2070 at 1.2207. If GBP/USD breaks below 1.2000, we should avoid buying. The eagle indicator is giving a positive signal which supports our bullish strategy.
Trading analysis offered by Flex EA.
Source #Unknown
Comments
Post a Comment