Early in the American session, the British Pound (GBP/USD) is trading at around 1.1760 and above 8/8 Murray (1.1718). We can see a strong bullish bias but the currency pair could face strong resistance at 1.1780.
According to the daily chart, we can see that the British pound reached a strong resistance zone around 1.1780 - 1.1760. In case the pound tries to break above this level, we could expect a quick rally towards +1/8 Murray (1.1962) and the price could even reach the psychological level of 1.20.
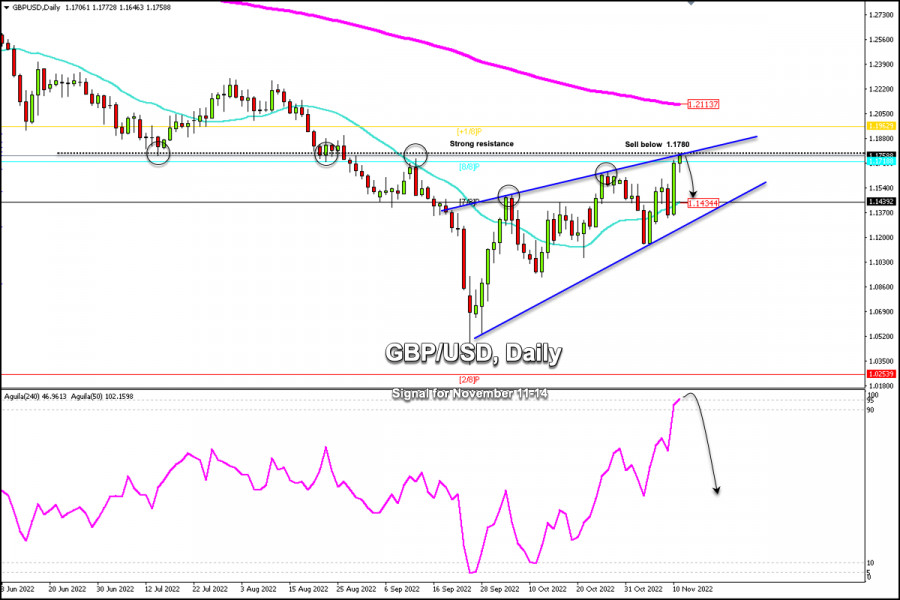
On the contrary, in case the British pound falls below this level (1.1780), we could expect a technical correction towards the 21 SMA located at 1.1434.
The eagle indicator is showing an overbought signal, so a technical correction is likely in the next few days only if the pound breaks below 1.1780.
On the other hand, we can observe the formation of an ascending triangle since September 16. The GBP/USD pair could be reaching the upper border of this triangle. With a sharp break below this technical pattern, we could expect a bearish acceleration and the price could reach the area of 1.0253 (2/8 Murray) in the medium term.
Our trading plan for the next few hours is to sell below 1.1780, with targets at 1.1718, at the psychological level of 1.15, and down to 21 SMA located at 1.1434. The Eagle indicator is giving a signal of exhaustion which supports our bearish strategy.
Trading analysis offered by Flex EA.
Source #Unknown
Comments
Post a Comment