As noted in our recent review, if the publication of US inflation data disappoints investors, it will provoke a new wave of dollar sell-offs and a drop in DXY towards 109.00. At that time, DXY futures were trading near 110.46. A deeper drop of the DXY was due up to the key support levels 107.40 and 105.65. The price went exactly under this scenario, breaking through the bottom of the downward channel on the DXY chart at 109.00 and reaching a local low of 105.15 in the next three days.
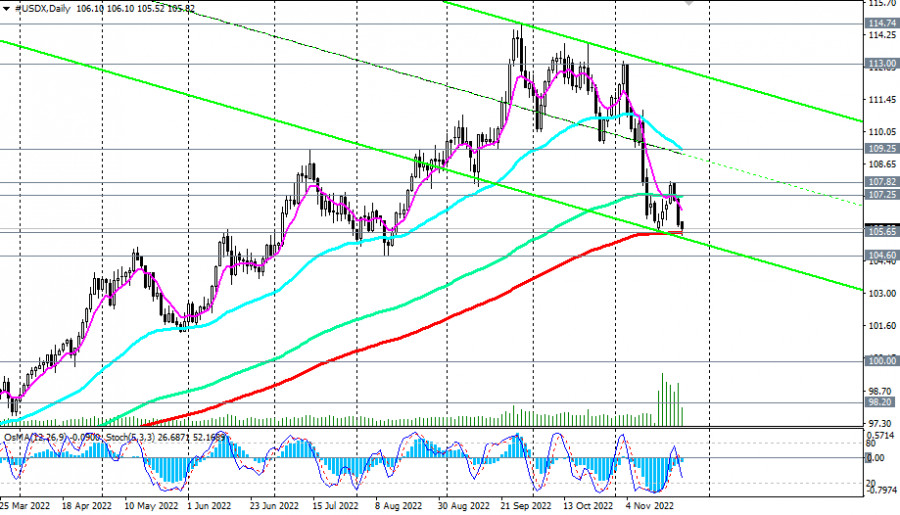
Today, the dollar index (CFD #USDX in the MT4 trading terminal) is trading in close proximity to the key support level of 105.65 (200 EMA on the daily CFD #USDX chart).
Economists suggest that the local support level 105.00 should hold.
If that is true, the current levels are almost ideal entry points into long positions, counting on a rebound from support at 105.65.
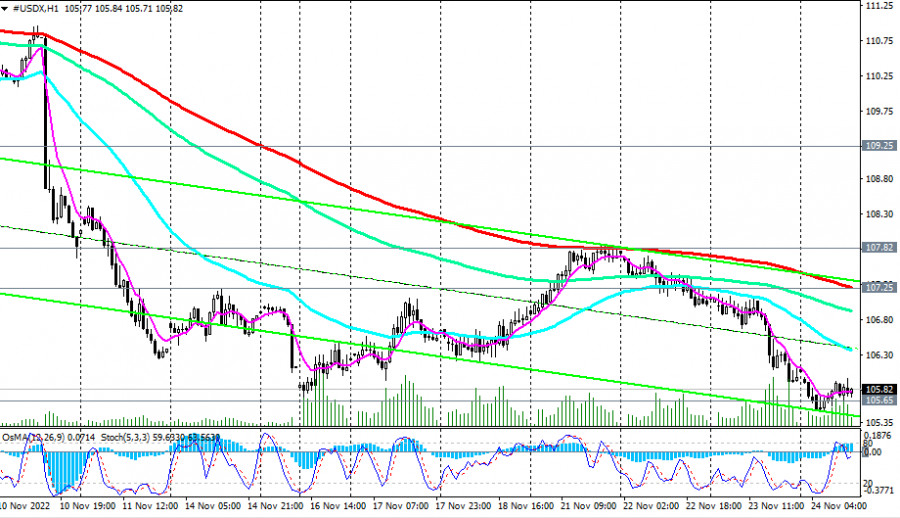
An increase above the resistance level of 107.25 (144 EMA on the daily chart and 200 EMA on the 1-hour chart) and 107.82 (local resistance level) would be a confirmation signal of the resumption of the upward dynamics of DXY.
Given growing concerns about the new outbreak of coronavirus, the ongoing geopolitical crisis in Europe, and the risks of a recession in the world's largest economies, demand for the dollar as a popular defensive asset may soon become one of the main drivers of its growth.
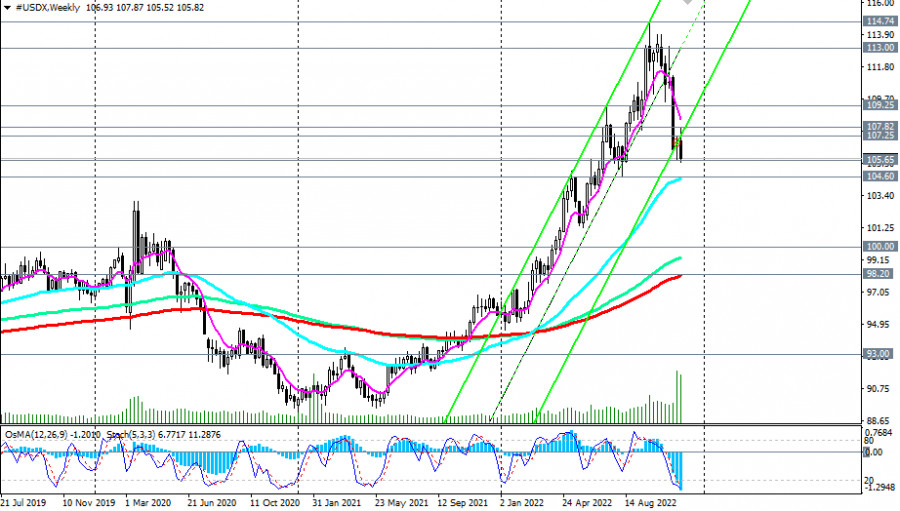
Alternatively, a breakdown of the support at 104.60 (50 EMA on the weekly chart) might worsen the USD and its DXY index, putting them in a bear market zone. A breakdown of the key support at 98.20 (200 EMA on the weekly chart) will break the bullish trend of the DXY.
Support levels: 105.65, 105.00, 104.60
Resistance levels: 107.25, 107.82, 108.00, 109.00, 109.25, 110.00, 111.00, 113.00
Trading Tips
Sell Stop 105.40. Stop Loss 106.20. Take Profit 105.00, 104.60
Buy Stop 106.20. Stop-Loss 105.40. Take-Profit 107.25, 107.82, 108.00, 109.00, 109.25, 110.00, 111.00, 113.00
Trading analysis offered by Flex EA.
Source #Unknown
Comments
Post a Comment