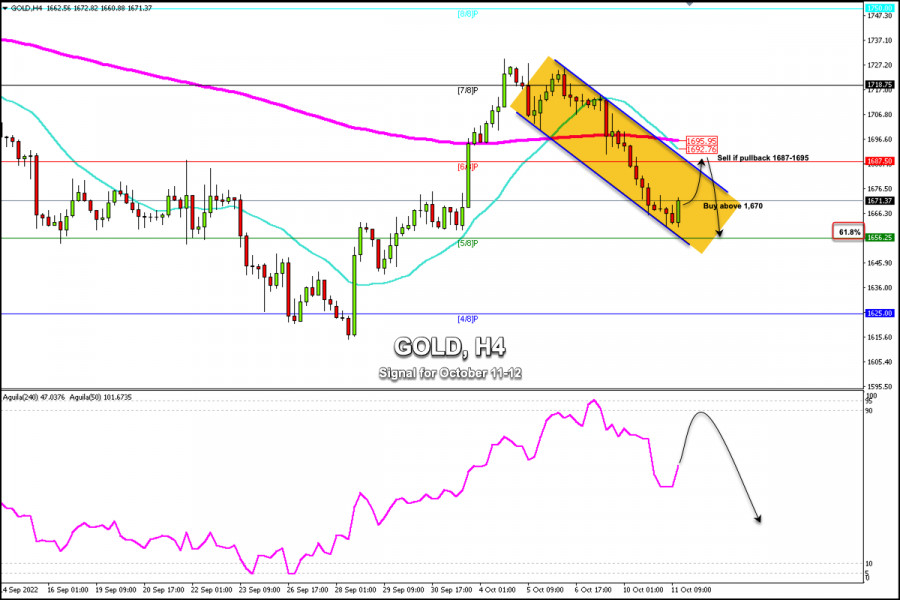
Trading Signal for Gold (XAU/USD) on October 11 - 12, 2022: buy above 1,670 (rebound - 61.8% Fibonacci)
Early in the American session, Gold (XAU/USD) is trading at around 1671. It is recovering from losses after hitting the 1,660 level in the European session. This technical rebound in gold is encouraged by a slight drop in yields of Treasury bonds.
The future of gold could be determined by the crisis between Russia and Ukraine. Yesterday, Russia confirmed attacks with long-range nuclear weapons. In case of further escalation, the price of gold could quickly rise due to the fact that it is a refuge asset and it could reach the level of 1,750 and even the psychological level of 1,800.
The last 4-hour candle shows a probable recovery of gold and its price could reach the 6/8 Murray zone around 1,687 in the next few hours. This level represents strong resistance. 1,692 (21 SMA) is located above this level and 1,695 matches the 200 EMA.
In case there is a pullback towards this area, it will be a clear signal to sell gold around 1,687 - 1,695 with targets at 1,670 and 1,656.
This technical bounce in gold could confirm that the retracement towards the 61.8% Fibonacci zone is complete and the metal could start a new bullish sequence. In case gold consolidates above 1,656 in the next few days, there is a chance that there will be a recovery and the price could reach the area of 1,718 and even 8/8 Murray at 1,750.
XAUUSD is expected to resume its bullish cycle in the next few hours and it can reach the top of the downtrend channel around $1,683. In case of breaking above, we should prepare to sell below 1,695 (200 EMA).
Our trading plan for the next works is to buy gold at current price levels around 1,660-1,670 with targets at 1,687 (6/8 Murray) and 1,695. The eagle indicator is showing a positive signal which supports our bullish strategy.
Trading analysis offered by Flex EA.
Source #Unknown
Comments
Post a Comment