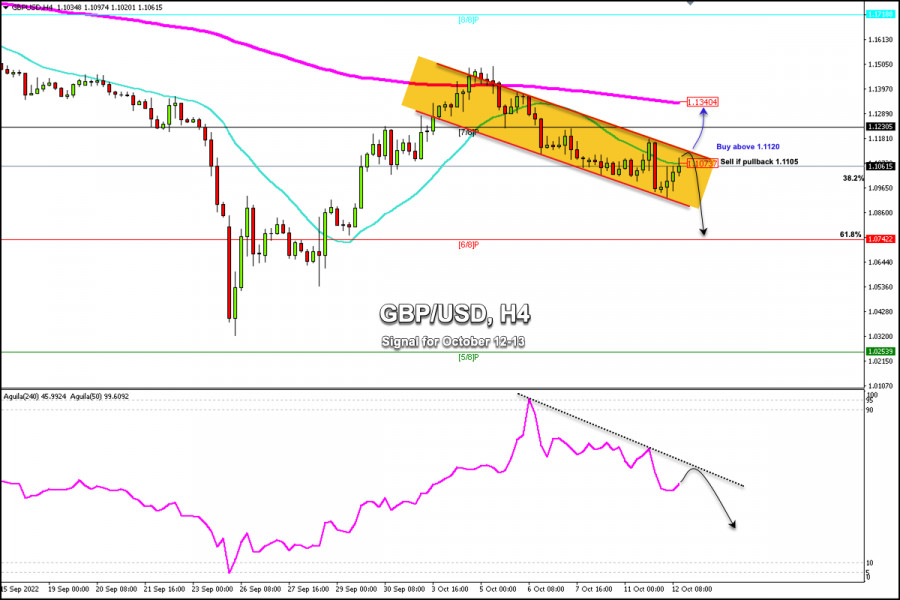
Trading Signal for GBP/USD on October 12 - 13, 2022: sell in case of pullback 1.1105 (bearish channel - 21 SMA)
In the Asian session, the GBP/USD pair fell to a low of 1.0923. Around this area, it found a strong technical rebound that reached the level of 1.1098 in the morning of the European session.
However, it is difficult for GBP to take advantage of the movement and pull back in the American session due to the fact that around 1.1073, there is the 21 SMA that acts as strong resistance.
The British Pound strengthened amid reports that the Bank (BoE) may be willing to extend its purchases beyond Friday. This news gave the pair bullish momentum, but it could remain under bearish pressure as long as it trades inside the bearish channel.
Investors are waiting for the fresh US consumer inflation data to be reported on Thursday, which should play a key role in boosting demand for dollars in the short term and could push GBP/USD under downward pressure and it could drop to 6/8 Murray at 1.0742.
According to the 4-hour chart, we can see that the British pound is trading inside a downtrend channel formed on September 30. The last bounce around the bottom of this channel helped it to recover and reach the area 21 SMA (1.1073).
In case the pair makes a pullback towards the zone of 1.1075 - 1.1105 where the top of the downtrend channel is located, it will be considered a signal to sell with targets at 1.1000 and 1.0925 and the price could even reach the 61.8% Fibonacci around 1.0742.
Our trading plan for the next few hours is to expect GBP/USD to technically exhaust and lose upside strength to sell around 1.1105 with targets at 1.0742.
Since October 5, the eagle indicator has been generating a negative signal. It is likely that any recovery of the pound could be viewed as an opportunity to continue selling.
Trading analysis offered by Flex EA.
Source #Unknown
Comments
Post a Comment