The EUR/USD pair dropped today as the Dollar Index has managed to print a strong rebound. It was trading at 0.9783 at the time of writing, far below 0.9872 today's high. As you already know from my analyses, the pair maintains a bearish bias despite temporary rebounds.
Yesterday, the Eurozone and the US economic data came in better than expected. Today, the Eurozone Final CPI rose by 9.9% versus the 10.0% expected, while Final Core CPI reported a 4.8% growth matching expectations.
On the other hand, the US Building Permits came in at 1.56M above the 1.52M expected, while Housing Starts dropped from 1.57M to 1.44M below the 1.46M expected.
EUR/USD Under Downside Pressure!
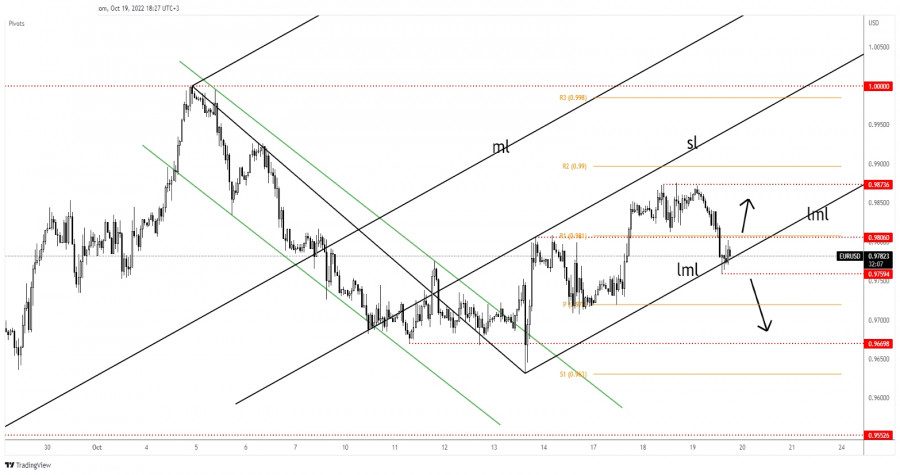
Technically, the rate found resistance at 0.9873 and now it challenges the ascending pitchfork's lower median line (lml) which stands as a dynamic support. 0.9806 represents a static resistance while 0.9759 today's low represents a downside obstacle.
As long as the currency pair stays above the lower median line (lml), within the ascending pitchfork's body, the price could regain new bullish momentum.
EUR/USD Forecast!
Staying above the lower median line (lml) and making a valid breakout through 0.9806 could bring more gains.
A valid breakdown below the lower median line (lml) and through the 0.9759 low activates more declines and brings a short opportunity.
Trading analysis offered by Flex EA.
Source #Unknown
Comments
Post a Comment