EUR/USD
Higher timeframes
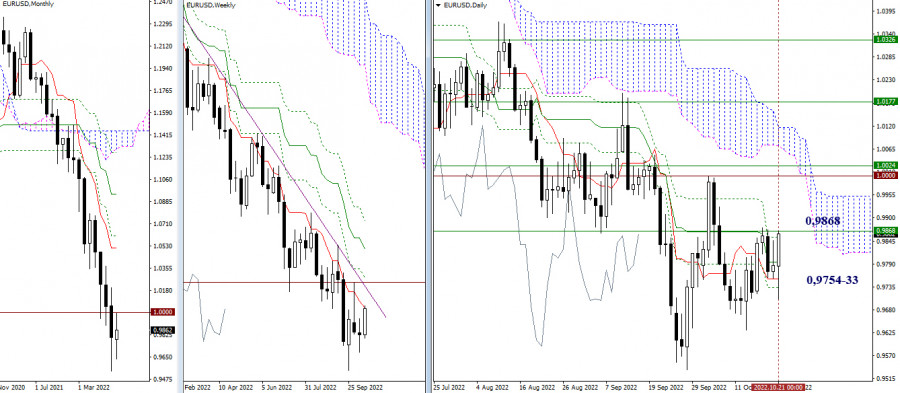
By the end of the week, the pair returned to the area of the weekly short-term trend (0.9868). Breakthrough and reliable consolidation above will switch attention to the resistance zone of 1.0000-1.0024 (psychological level + weekly Fibo Kijun). The daily cross (0.9794 – 0.9754 – 0.9733) is now consolidating its efforts to contain the situation and serve as a support for bulls. Further, overcoming the lowest extremums 0.9632 - 0.9536 will be important.
H4 – H1
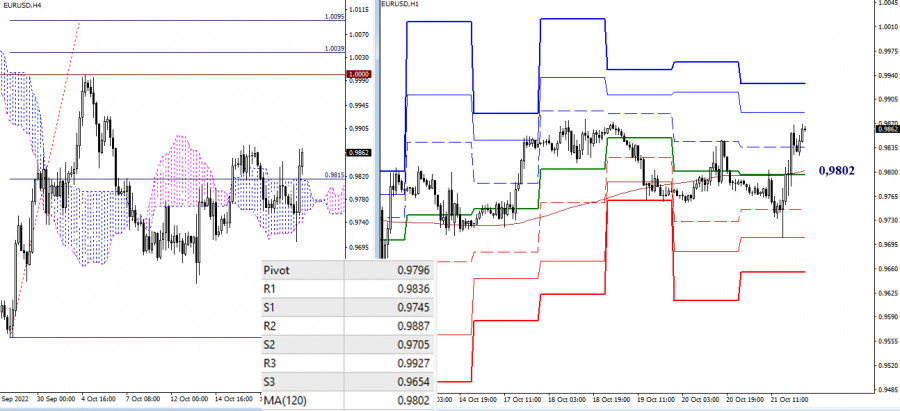
The main advantage in the lower halves belongs to the players to increase. In addition to the resistance of the classical Pivot levels, the target for the breakdown of the Ichimoku cloud H4 (1.0039 - 1.0095) can be attributed to upward references in the current situation, which was not fully realized earlier, therefore, retains its value. If the support of the weekly long-term trend returns to the bears, then the advantages will again be on the side of the supporters of the decline. Reference points for intraday decline will be the support of the classic Pivot levels.
***
GBP/USD
Higher timeframes
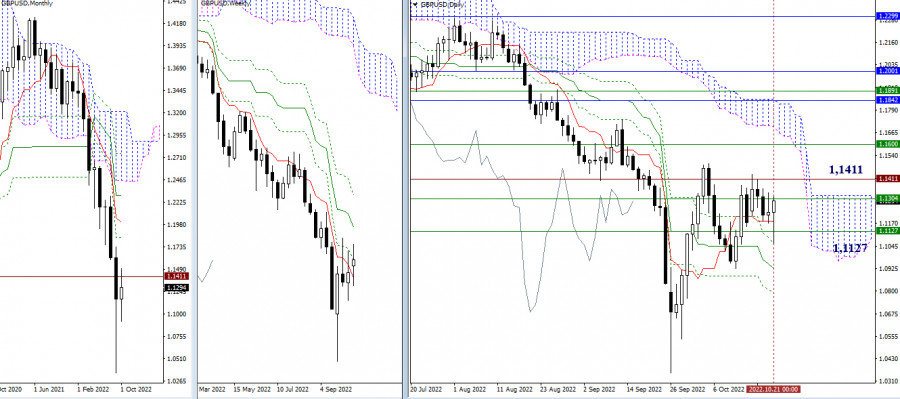
At the moment, the pair is working within the boundaries, which are formed by the historical level of 1.1411 and the levels of the weekly cross (1.1304-1.1127). Going beyond will open up opportunities for players to test the weekly medium-term trend (1.1600) and rise to the daily Ichimoku cloud. If traders seem bearish, then going beyond 1.1127 will set the task of eliminating the current Ichimoku golden cross in the daytime, for this it will be necessary to overcome its final supports (1.0925-1.0790).
H4 – H1
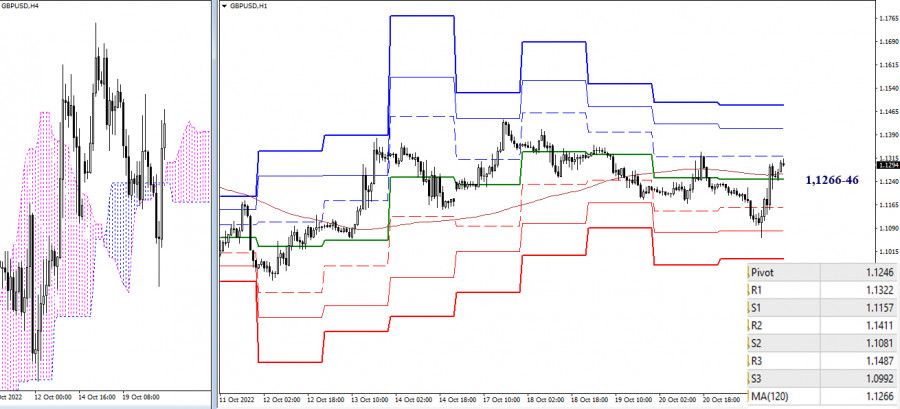
On the lower timeframes, the pair is now in the zone of attraction of the weekly long-term trend (1.1266). This means that there is a state of some balance, and there is no obvious preponderance of forces. If the bulls take advantage, then the resistance of the classic Pivot levels will act as benchmarks for continuing the growth within the day, their latest values can be noted on 1.1322 – 1.1411 – 1.1487 . In the event that there is an increase in bearish sentiment, then the support of the classic Pivot levels will become the benchmarks for the decline within the day.
***
In the technical analysis of the situation, the following are used:
Higher timeframes – Ichimoku Kinko Hyo (9.26.52) + Fibo Kijun levels
H1 – Pivot Points (classic) + Moving Average 120 (weekly long-term trend)
Trading analysis offered by Flex EA.
Source #Unknown
Comments
Post a Comment