EUR/USD analysis on October 14. American statistics disappointed traders, but the dollar is growing again.
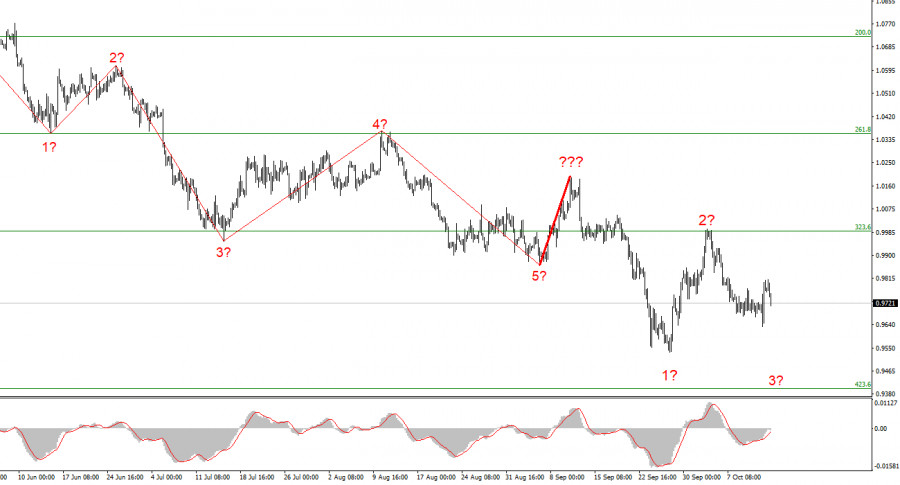
The wave marking of the 4-hour chart for the Euro/Dollar instrument still does not require adjustments at the moment, but it is undoubtedly becoming more complicated. It may be more complicated than that in the future. We saw the completion of the construction of the next five-wave impulse descending wave structure, then one upward correction wave (marked with a bold line), after which the low waves of 5 were updated. These movements allow me to conclude that the pattern of five months ago was repeated when the 5-wave structure down was completed in the same way, one wave up, and we saw five more waves down. There is no question of any classical wave structure (5 trend waves, 3 correction waves) right now. The news background is such that the market even builds single corrective waves with great reluctance. Thus, in such circumstances, I cannot predict the end of the downward trend segment. We can still observe for a very long time the picture of "a strong wave down-a weak corrective wave up." The goals of the downward trend segment, which has been complicated and lengthened many times, can be found up to 90 figures or even lower. At this time, wave 3 of the descending trend section may be built (presumably), but the descending section may also transform into an ascending one.
The market moved away from American inflation only a day later.
The euro/dollar instrument fell by 40 basis points on Friday, but the movements of yesterday evening were more interesting. At first, the instrument fell by 100 points, then rose by 170, and by the current moment, it has returned to the level of 0.9730, from which it started moving yesterday. Thus, the market reaction to the report on American inflation was very strong and unexpected. Why did it happen that the euro currency managed to fall, grow, and fall again? In my opinion, this is a standard reaction to extremely important events. At such moments, the market cannot unambiguously interpret the event as negative or positive, so a panicked opening of transactions begins, which leads to movements in different directions. Inflation decreased by only 0.1% y/y, while core inflation (excluding food and energy prices) rose to 6.6% y/y. The demand for the US currency was supposed to grow after this information, but at the moment, as I said, the instrument has returned to the levels at which it was before the inflation report.
This, by the way, was not prevented even by new data on the state of the American economy. The September retail trade volume report was worse than market expectations and amounted to only 0.0% m/m. In half an hour or an hour, another consumer sentiment index from the University of Michigan will be released, which has been very low for the past year. I do not expect a positive from this report, but I note that the demand for the US currency is growing today without this positive. Due to today's decrease in the instrument, the probability of continuing the construction of the expected wave 3 of the downward trend section remains. But the demand for the dollar must continue to grow for this wave to continue building.
General conclusions.
Based on the analysis, I conclude that the construction of the downward trend section continues but can end at any moment. At this time, the instrument can build a new impulse wave, so I advise selling with targets near the estimated mark of 0.9397, which equates to 423.6% by Fibonacci and by MACD reversals "down." I urge caution, as it is unclear how much longer the overall decline of the instrument will continue.
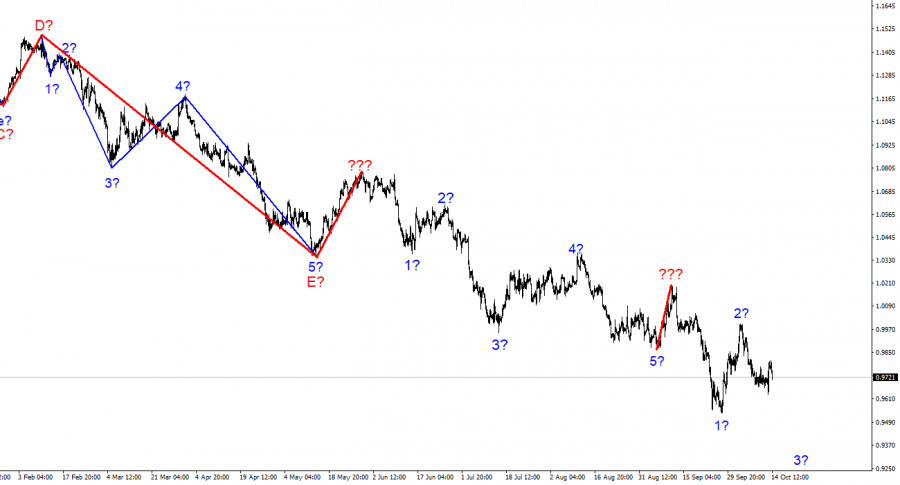
At the higher wave scale, the wave marking of the descending trend segment becomes noticeably more complicated and lengthens. It can take on almost any length, so I think it's best to isolate the three- and five-wave standard structures from the overall picture and work on them. One of these five waves has just been completed, and a new one has begun its construction.
Trading analysis offered by Flex EA.
Source #Unknown
Comments
Post a Comment