Overview :
The EUR/USD pair is down -1.26% to €1 in the last 24 hours. The EUR/USD pair dropped below the 1.0078 0 level for the first time for two days. The price of 0.9957 is coincided with the major support in the hourly time frame.
Right now, the EUR/USD pair stood at 1 USD, after touching a high of 1.0078 earlier in the day. But the EUR/USD pair has rebounded from the price of 1.0078 to close below the price of 1.0078. Euro parity still in play ahead of decisive US inflation data, for that common currency came within whisker of $1 this week. The EUR/USD pair is still moving around the price of 1.0000.
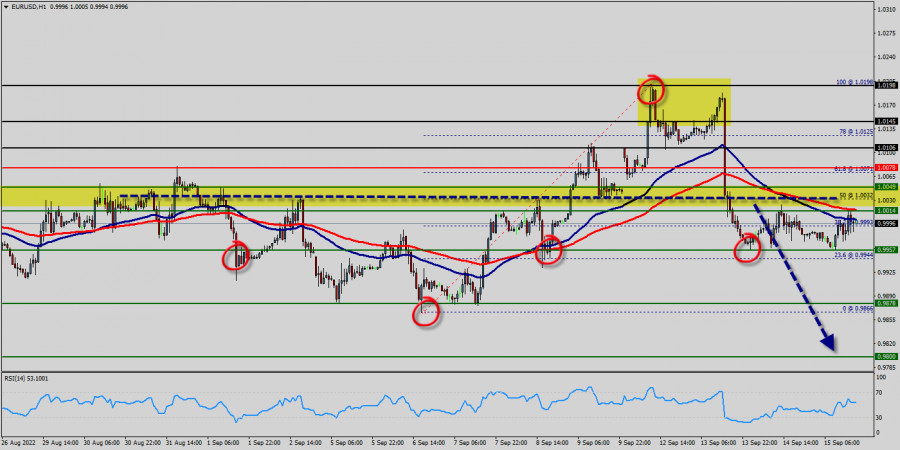
Please, note that the prices of 1.0032 and 1.0072 coincide with the Fibonacci expansion of 50% and 61.8% respectively. 1.0078 has been in a volatile trading range for almost a week now, bouncing between 1.0032 and 1.0072.
Resistance of the EUR/USD pair is seen at the prices of 1.0032 and 1.0072. The EUR/USD pair is trading below its resistance for a while.
It is likely to trade in a lower range as long as it remains below resistance. Furthermore, it should bear in mind that resistance has set at 1.0032.
The EUR/USD pair has made an important significant movement from yesterday. For that my foresee will focus on bearish market in my technical outlook.
The bias remains bearish in the nearest term testing 0.9957 or lower. If the trend can break the first target at 0.9957, the market will call for a strong bearish trend towards the next target at 0.9866 in order to test the double bottom on the hourly chart.
The US Dollar and the Euro are two of the most prominent and well-known currencies in the world. The Euro versus US Dollar (EUR/USD) currency pair has the largest global trading volume, meaning it is the world's most-traded currency pair. Whether you find the instrument easy or difficult to trade on, it's not a pair that many traders neglect, due to its daily volatility and price movement.
However, stop loss has always been in consideration. Thus it will be useful to set it above the last double top at the level of 1.0198 (notice that the major resistance today has set at 1.0198).
Downtrend scenario :
On the downside, the 0.9957 level represents support. The next major support is located near the 0.9866, which the price may drift below towards the 0.9866 support region. This would suggest a bearish market because the RSI indicator is still in a negative area and does not show any trend-reversal signs. The pair is expected to drop lower towards at least 0.9866 in order to test the third support (0.9803).
Forecast:
The volatility is very high for that the EUR/USD pair is still moving between 1 USD and 0.9866 in coming hours. Consequently, the market is likely to show signs of a bearish trend again. As a result, it is gainful to sell below this price of 1 USD with targets at 0.9957 and 0.9866. On the other hand , the bullish trend is still expected for the upcoming days as long as the price is above 1.0100. The EUR/USD pair is a subject to high market risk. My analysis will make the best efforts to choose high-quality of my forecast, but will not be responsible for your trading losses. Please trade with caution.
Trading analysis offered by Flex EA.
Source #Unknown
Comments
Post a Comment