The price of gold has dropped like a rock today and now it is trading at the 1,701 level. Unfortunately, XAU/USD failed to stay in the buyer's territory, so a deeper drop is in the cards.
Fundamentally, the RBA increased the Cash Rate from 1.85% to 2.35% matching expectations. Also, the BOC and the ECB are expected to hike rates during the week, that's why the yellow metal could approach and reach new lows. Moreover, the US ISM Services PMI came in at 56.9 versus the 55.4 points expected. USD's appreciation could send XAU/USD down.
XAU/USD Bearish Pattern Activated!
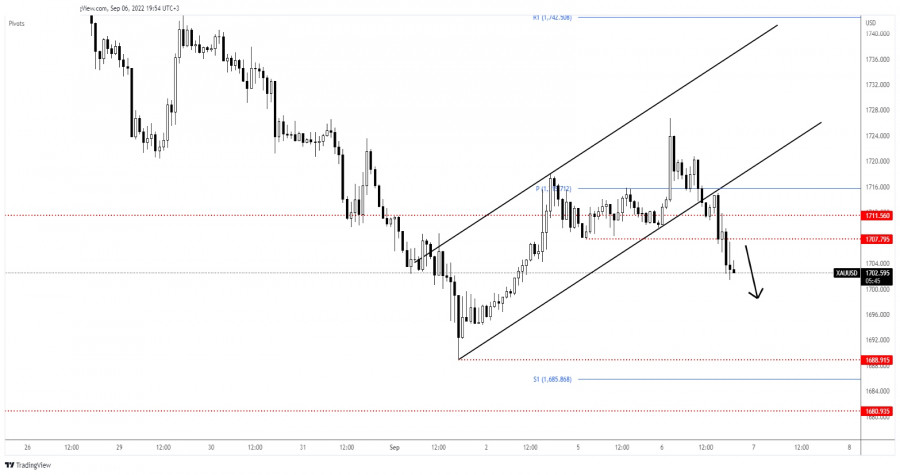
Technically, XAU/USD failed to stay above the weekly pivot point of 1,715 and above the uptrend line signaling that the leg higher ended and that the sellers could take the lead.
In the short term, the metal has tried to retest the broken uptrend line and the pivot point confirming the breakdown.
XAU/USD Forecast!
Breaking below the 1,707 static support signaled more declines. Actually, the breakdown was seen as a short opportunity. Gold is strongly bearish, so it could approach and reach fresh new lows. 1,688 stands as a potential target if the rate continues to drop.
Trading analysis offered by Flex EA.
Source #Unknown
Comments
Post a Comment