Bitcoin, Ethereum - Talking Points
Recommended by Brendan Fagan
Get Your Free Introduction To Cryptocurrency Trading
Get My Guide
Bitcoin & Ethereum Outlook: Bearish
Bitcoin and Ethereum both took a nosedive this week as a hotter-than-expected US CPI print weighed heavily on global risk assets. The crypto space currently faces a significant number of headwinds, from dwindling risk appetite to potential regulation from Washington. The Fed’s ambitious tightening campaign has dried up appetite for speculative assets, as the US central bank continues to battle against historic inflation. Cryptocurrencies may come under renewed pressure as the Fed looks set to raise interest rates by another 75 basis points next week, with the door remaining open for a potential 100 basis point rate hike.
For many crypto investors and traders, the attention was all on Ethereum this past week. The network successfully completed its largest ever upgrade, known simply as “the merge.” The merge is designed to slash the crypto’s energy use by over 99%, with the first “proof of stake” transactions completing with almost a 100% client participation rate. The merge will also change the security protocol of the network while also improving the verification process for transactions.
Bitcoin was hit particularly hard during last Tuesday’s session, sinking from $22750 all the way to the key $20400 level. In the wake of the repricing of Fed expectations, Bitcoin continued to grind lower as upside was limited by trendline resistance. Price has since fallen below the key $20000 psychological mark, with fib support at $19225 coming into view. There is a larger support zone here around $19000 that may prop prices up into next week’s key FOMC meeting. At the moment Bitcoin remains a barometer for risk, and investors continue to be reluctant to put money to work in speculative assets. I expect the trend to remain lower into FOMC, with direction into next weekend hinging on any surprises we may get in the dot plots or press conference.
Bitcoin 1 Hour Chart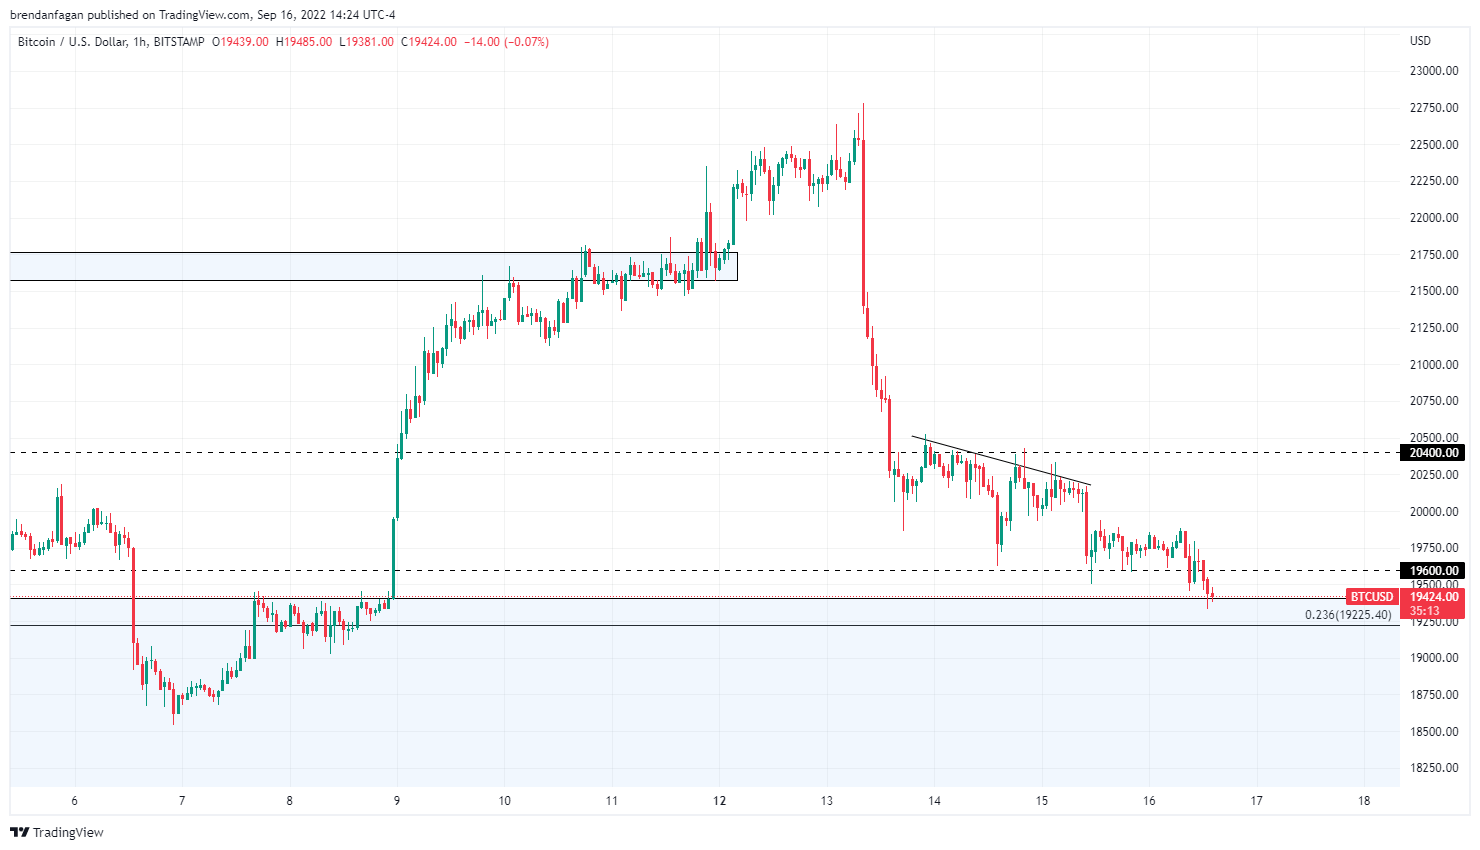
Chart created with TradingView
Ethereum was the focus of many this week following the completion of “the merge.” The event has played out as a “buy the rumor, sell the fact” event, with investors dumping ETHUSD following the completion of the upgrade. Tuesday’s CPI print saw price slice through the support zone that had been carved out around $1700, while further declines have taken price back to a key support zone around $1400. The swift decline in Ethereum’s price encapsulates the risk-off nature of financial markets of late, as traders remain at the mercy of an aggressive Federal Reserve. With another significant rate hike set for next week, it may be a matter of time before Ethereum cuts through this current support level at $1400. Should more downside action occur, I would look to the $1250 area for initial support. Overhead resistance remains at $1600.
Ethereum 1 Hour Chart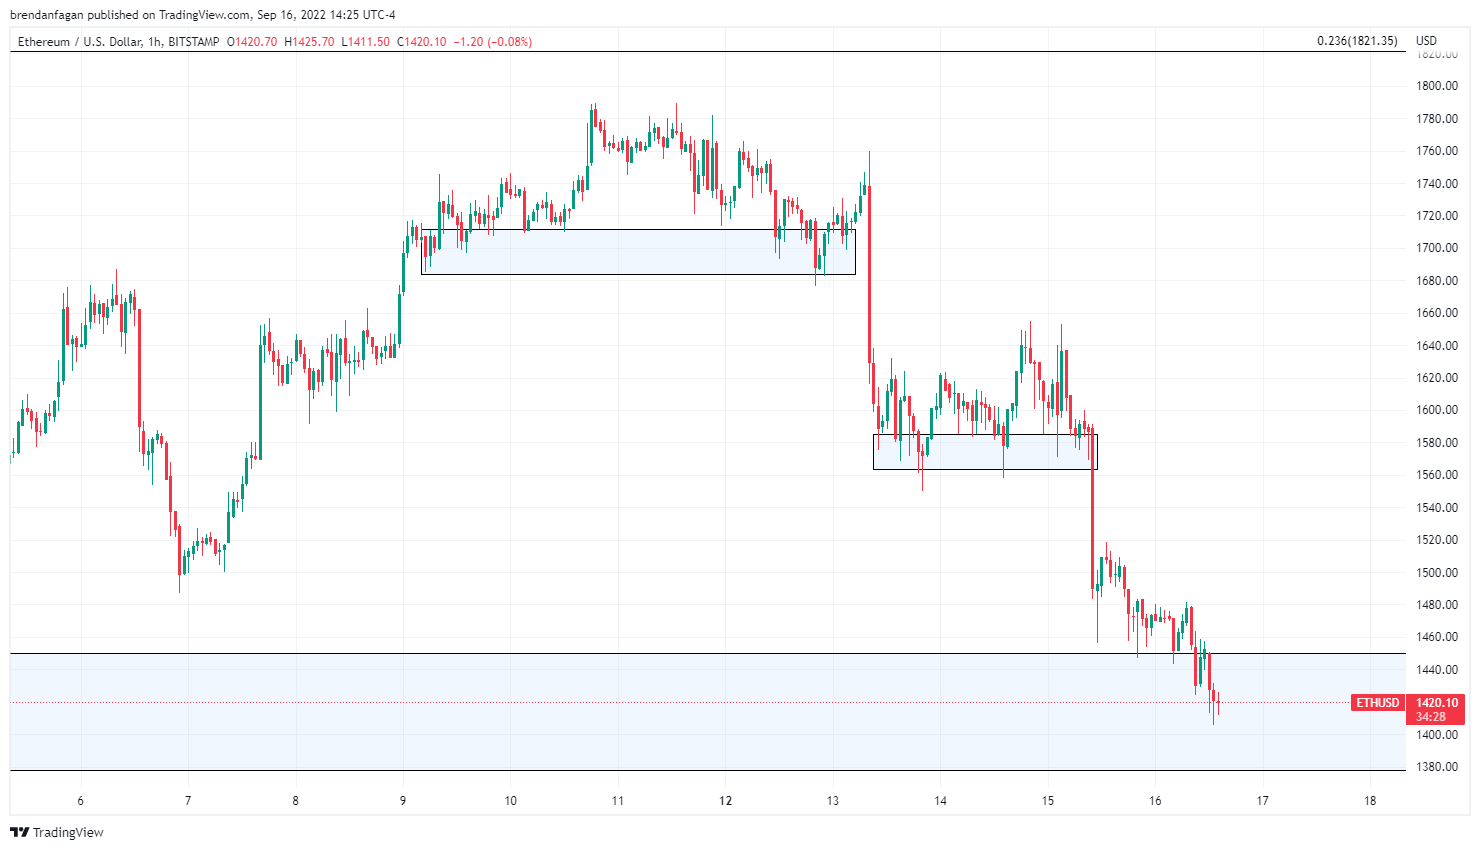
Chart created with TradingView
Trade Smarter - Sign up for the DailyFX Newsletter
Receive timely and compelling market commentary from the DailyFX team
Subscribe to Newsletter
Resources for Forex Traders
Whether you are a new or experienced trader, we have several resources available to help you; indicator for trackingtrader sentiment, quarterlytrading forecasts, analytical and educationalwebinarsheld daily,trading guidesto help you improve trading performance, and one specifically for those who arenew to forex.
Trading analysis offered by Flex EA.
Source #Unknown
Comments
Post a Comment