The US Dollar aimed higher against its major counterparts this past week, fulfilling a move that markets had been building up since the beginning of August. Throughout June and July, the markets priced in a pivot narrative for the Federal Reserve despite the highest inflation in 40 years and the most aggressive tightening in decades.
This contrasted with the tone coming out of the Fed. It seemed that last week, the two finally moved into unison. Chair Jerome Powell’s speech at the annual Jackson Hole Economic Symposium seemed to do the trick. He reiterated much of the language that officials had been saying for weeks, adding that some households could feel the pain from the central bank’s policy tightening.
Looking at the implied Fed policy curve in the aftermath of the symposium, the markets increased the overall rate outlook by 25 basis points. It should also be noted that quantitative tightening is continuing. The central bank’s balance sheet sits around 8.8 trillion, which is the lowest since the beginning of this year. Last week was the worst 5-day period for the S&P 500 (-3.79%) since mid-June.
A reintroduction of market volatility is likely to bode well for the anti-risk US Dollar. All eyes in the week ahead are thus turning to August’s non-farm payrolls report. The US is seen adding around 300k jobs with the unemployment rate holding steady at 3.5%. Average hourly earnings are also seen at 5.2% y/y, unchanged from July.
Another sign of a tight labor market will likely uphold the central bank’s policy tightening. This past week, personal spending and income data showed that wages/salary rose 0.8% from 0.6% previously. Wages tend to be sticky, undermining the transitory inflation narrative. Further signs of such a battle risk keeping volatility elevated, which is a scenario that the US Dollar can enjoy.
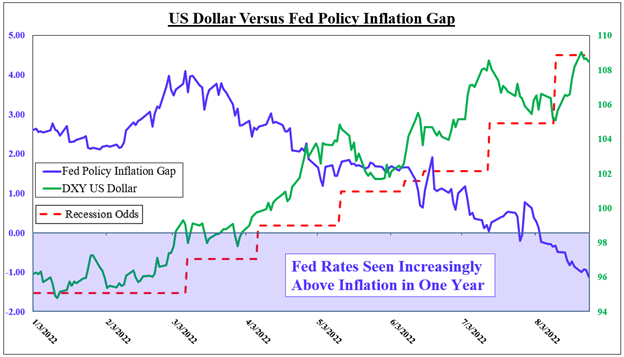
In the chart below, the US Dollar can be seen following rising odds of a recession (economists polled by Bloomberg). Meanwhile, due to rising Fed rate bets and fading inflation expectations (both in one year), the policy gap is entering negative territory. In other words, the Fed is seen taking rates above inflation, a sign that the central bank’s message and action are working.
Trading analysis offered by Flex EA.
Source #RobotFX Team
Comments
Post a Comment