Overview :
The US dollar's strong gains against the Euro have continued today ahead of the sturdy news. The common currency reached a high of more than three days earlier this morning.
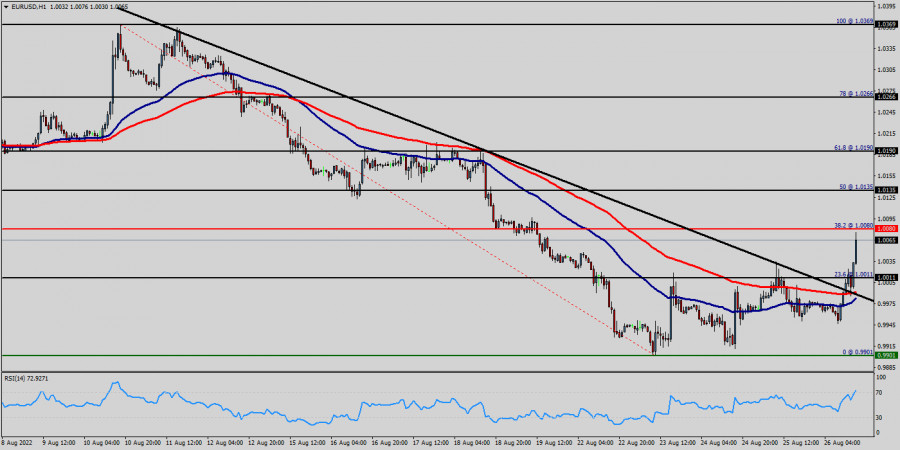
This technical analysis of EUR/USD looks at the one-hour chart. The highest price that EUR/USD reached for that period was 1.0080 (last bullish wave - top). The lowest price that the EUR/USD pair reached during that period was 1.0080 (right now).
The bias remains bearish in the nearest term testing 1.0011 or lower. Immediate support is seen around 1.0011. A clear break below that area could lead price to the neutral zone in the nearest term.
Price will test 1.0011, because in general, we remain bearish on August 26h, 2022. Yesterday, the market moved from its top at 1.0080 and continued to drop towards the top of 1.0011.
Today, on the one-hour chart, the current fall will remain within a framework of correction. However, if the pair fails to pass through the level of 1.0080 (major resistance), the market will indicate a bearish opportunity below the strong resistance level of 1.0080 (the level of 1.0080 coincides with tha ratio of 38.2% Fibonacci retracement).
The EUR/USD pair settled below 1.0080 and is testing the support level at 1.0011. RSI and Moving averages continue to give a very strong sell signal with all of the 50 and 100 EMAs successively above slower lines and below the price. The 50 EMA has extended further below the 100 this week. Support from MAs comes initially from the value zone between the 50 and 100 EMAs. Industriously, Euro Is Losing ground against U.S. Dollar around +125 pips.
Since there is nothing new in this market, it is not bullish yet. Sell deals are recommended below the level of 1.0080 with the first target at 1.0011 and continue towards 0.9901 so as to test the double bottom.
If the trend breaks the double bottom level of 0.9901, the pair is likely to move downwards continuing the development of a bearish trend to the level of 0.9850 in order to test the weekly support 3.
According to the previous events the price is expected to remain between 1.0080 and 0.9850 levels. Sell-deals are recommended below the price of 1.0080 with the first target seen at 1.0011. The movement is likely to resume to the point 0.9901. The descending movement is likely to begin from the level 0.9901 with 0.9850 and 0.9800 seen as new targets in coing hours.
On the other hand, the stop loss should always be taken into account, for that it will be reasonable to set your stop loss at the level of 1.0135.
Trading analysis offered by Flex EA.
Source #RobotFX Team
Comments
Post a Comment