Trading Signal for USD/JPY for July 28 - 29, 2022: buy above 134.37 (6/8 Murray - bottom bearish channel)
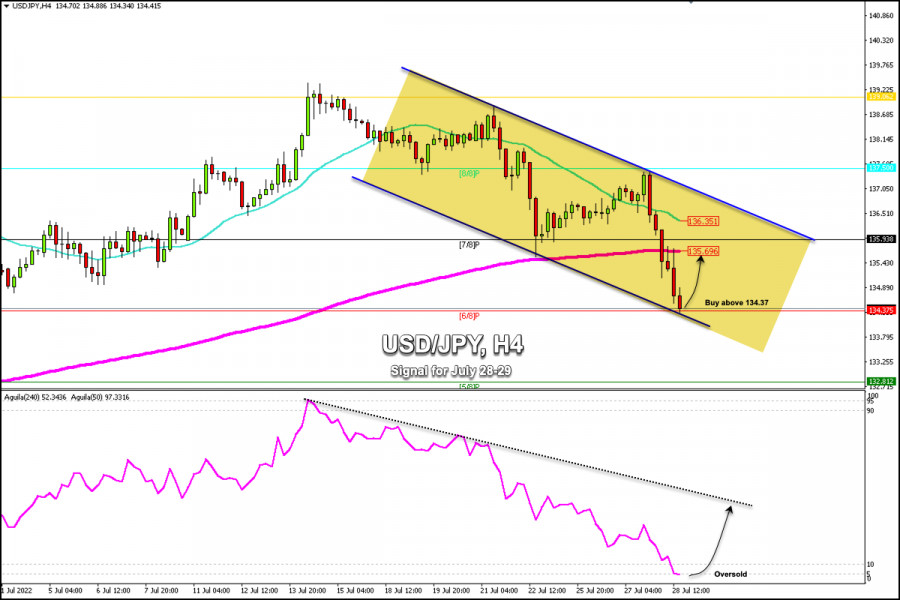
Early in the American session, the USD/JPY pair is trading at around the key 6/8 Murray support and around the bottom of the downtrend channel formed on July 13th.
The last six candles on the 4-hour chart appear bearish due to strong selling after the FOMC meeting, so the pair fell from 137.45 (8/8 Murray). This marks the second day in a row of negative movement and has dragged the pair to a new monthly low at around 134.34.
From a technical point of view, USD/JPY could extend its strength if it consolidates below the 200 EMA located at 135.69. This will be seen as a new trigger for the bears and the pair could drop to 5/8 Murray at 132.81.
The subsequent drop below the 50% Fibonacci level (135.48) of the strong bullish move from 131.50 to 139.39 validates the negative outlook.
In light of this, bearish traders could wait for some selling below the 135.69 (200 EMA) area but could be capped by strong support at 134.37 (6/8 Murray).
The 61.8% Fibonacci level of the strong bullish move from 131.50 to139.3 stands at 134.30. This should provide strong support to the pair and the price could resume the bullish bias in the coming days.
A convincing breakout and daily close below 6/8 Murray should pave the way for an extension of the recent corrective decline and the price could reach the psychological level of 130.00.
On the other hand, any attempt at a technical rebound could be curtailed due to the barrier at 135.69 and at 7/8 Murray at 135.93. A return above the 21 SMA located at 136.35 and a sharp break of the downtrend channel could mean a resumption of the uptrend and the price could reach 137.50 and 139.06.
The eagle indicator has reached the 5-point zone which represents extreme overselling. In the coming days, the Japanese yen is likely to make a strong technical bounce and it could reach the 135.90 area or even the 21 SMA and 136.35.
Trading analysis offered by RobotFX and Flex EA.
Source #RobotFX Team
Comments
Post a Comment