Technical outlook:
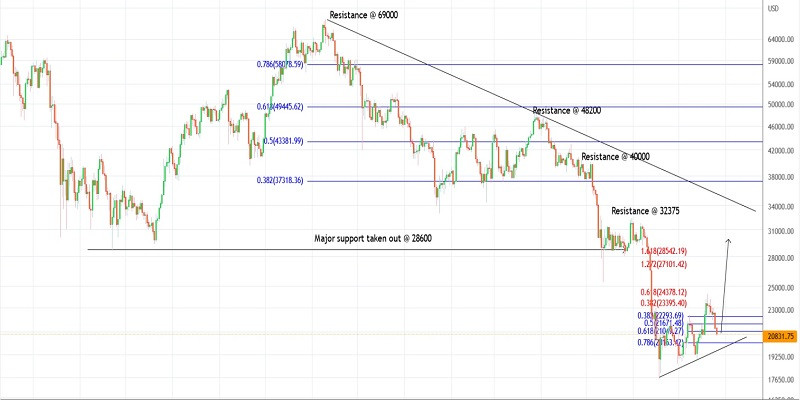
Bitcoin slipped through the $20,700 lows intraday on Tuesday only to find some support. The crypto is bouncing back and is seen to be trading close to $20,900 at this point in writing. Interim support is seen at around $18,900 for the time being and the bulls are expected to remain in control until it stays intact. Potential medium-term targets are seen towards $29,000 as projected here on the daily chart.
Bitcoin has already carved a larger-degree downswing between $69,000 and $17,500 since November 2021. The above drop is unfolding in three waves until now and hence, it is corrective in nature. The high probability remains for another three-wave rally towards $48,000 or at least towards $29,000 before bears could be back in control.
Keeping the suggested wave structure in mind, we have been considering Bitcoin positional longs from the $17,500-18,900 lows recently. Bitcoin might still have some upside left towards the $29,000 mark if not further. The bottom line for the above bullish structure to remain intact is that prices should broadly hold above $18,900 and $17,500.
Going forward:
Bitcoin has been working upon its recent upswing between $18,900 and $24,200 as seen on the daily chart. Prices are now testing the Fibonacci 0.618 retracement of the above upswing, which is seen close to $21,000. The high probability remains for a bullish reversal from here and a climb towards the $29,000 mark in the next few weeks.
Trading plan:
Potential rally through $29,000 against $18,800
Good luck!
Trading analysis offered by RobotFX and Flex EA.
Source #RobotFX Team
Comments
Post a Comment