Litecoin dropped after reaching a new higher high of 64.58. Now, it is traded at 61.10 at the time of writing. It has retreated as the price of Bitcoin dropped after its strong growth. The altcoin reached the near-term downside obstacles. It remains to see how it will react around these support levels.
Technically, the price action signaled exhausted buyers, we cannot exclude a larger drop in the short term. In the last 24 hours, LTC/USD is down by 3.25% but it's up by 6.96% in the last 7 days.
LTC/USD Retests The Buyers!
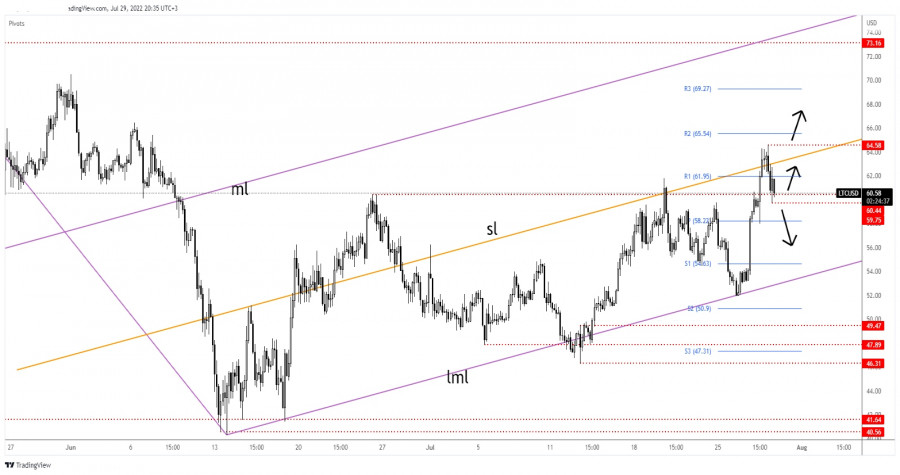
As you can see on the H4 chart, the rate jumped above the inside sliding line (sl) but it has failed to stay above it signaling exhausted buyers. I've told you in my previous analysis that LTC/USD could resume its growth if it validates its breakout above the sliding line.
Now, it challenges the 60.44 static support (resistance turned into support). Consolidation above it could announce a new bullish momentum. Dropping below 59.75 today's low could activate more declines.
LTC/USD Forecast!
Staying above 60.44 and making a new higher high, a valid breakout above 64.58 activates further growth.
Trading analysis offered by RobotFX and Flex EA.
Source #RobotFX Team
Comments
Post a Comment