The Euro edged just cautiously higher against the US Dollar this past week. This seemed to be largely a result of broad-based weakness in the Greenback, allowing the single currency to capitalize on a depreciating dollar. What fueled this? It appeared to be markets further pricing in a pivot from the Federal Reserve. Are traders getting ahead of themselves, setting up for disappointment?
The Euro-Area economic docket is rather thin in the week ahead, so the focus on EUR will likely depend on external factors. In this case, it might make sense to look at what is going on in the United States. Although, it should be noted that the European Central Bank has been pushing out increasingly hawkish commentary as of late. But, as we will see, it still pales in comparison with the Fed.
Sentiment recovered this past week, pushing the tech-heavy Nasdaq 100 higher. In July, the index gained about 12.5%, making for the best monthly performance since 2020. This is despite the Fed delivering a 75-basis point rate hike this past week, with Chair Jerome Powell making it clear that the central bank needs to fight and bring down inflation. The haven-linked US Dollar depreciated.
However, the central bank seemed to de-emphasize forward guidance and pivot to a more ‘meeting-by-meeting’ approach, stressing data dependency. Puzzlingly, inflation data would suggest there is still much more to do. If you take a closer look, the markets may be pricing in a dovish pivot due to rising concerns of a recession. US GDP this past week showed that the economy contracted for a second quarter, meeting the technical definition of a recession.
That likely helped the Euro rally to a certain extent. However, markets might be getting ahead of themselves. Inflationary data this past week continued to show that the Fed has a problem to tackle. The Employment Cost Index, which is the central bank’s preferred wage gauge, surprised higher at 1.3% q/q in Q2 versus 1.2% seen. Meanwhile, the Fed’s ideal inflation gauge also beat estimates.
This is quite an unusual situation for the central bank. Growth is weakening but inflation is still running hot, perhaps due to a tight labor market – see chart below. Some may view this as a sign of stagflation. US job openings are still robust, the unemployment rate is quite low and labor force participation never recovered back to pre-pandemic levels. Does this mean there is room for growth to continue weakening and for the jobs market to have room to absorb this deterioration? Perhaps.
In the week ahead, all eyes will thus be on the next non-farm payrolls report. For July, the economy is seen adding 250k positions, with unemployment sticking to 3.6%. A slight slowdown is seen in average hourly earnings, with a 4.9% y/y outcome expected from 5.1% prior. These are still healthy estimates and will likely contrast with the Fed pivot markets are expecting. As such, remain vigilant. Volatility can still return, opening the door for a US Dollar reversal, thus pressuring the Euro.
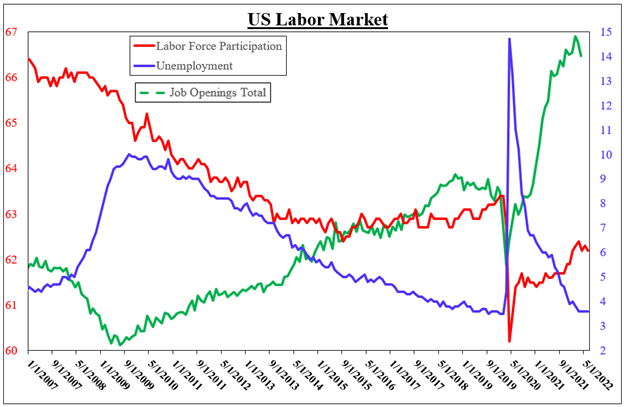
Data Source – Bloomberg, Chart Created by Daniel Dubrovsky
Trading analysis offered by RobotFX and Flex EA.
Source #RobotFX Team
Comments
Post a Comment