- The EURJPY is down close to 2% on the day
The EURJPY is the biggest mover on the day. The pair has declined nearly 2% (down -1.97% currently). The current price is at 136.51. The low for the day reached 136.39.
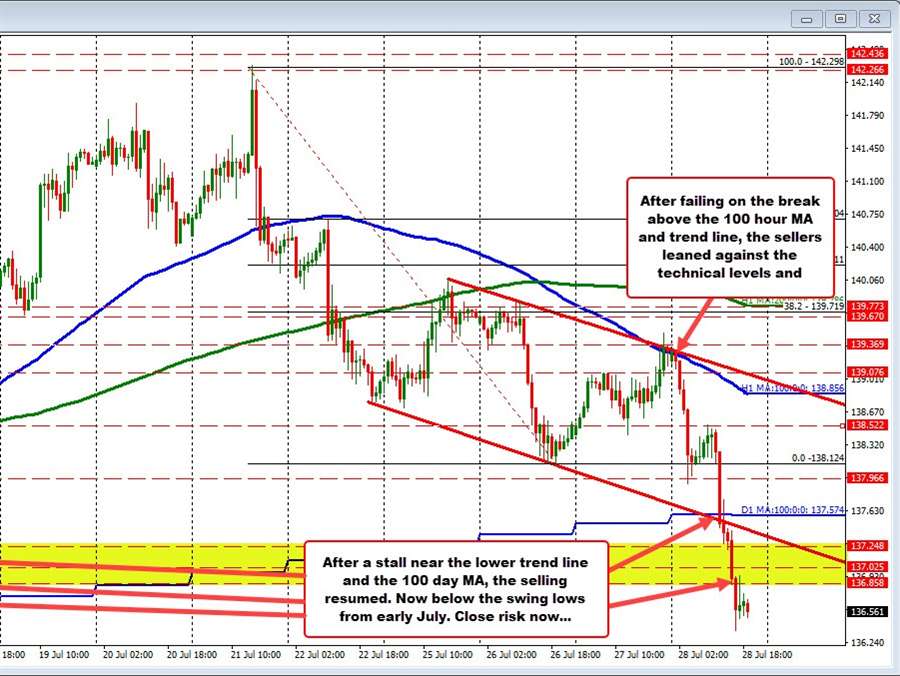
Technically, the day started with the pair banging against the 100 hour MA (blue line in the chart above) and a downward sloping trendline connecting highs from Monday and Tuesday. Both those levels came in near 139.30.
Admittedly, yesterday during the FOMC volatility , the price moved above those technical levels, but could not sustain momentum. Sellers started to lean against the levels into the early Asian session today, and then moved away from the levels. That was an early clue for the sellers. Buyers turned to seller after leaning against trendline and moving average resistance.
The move lower moved all the way down to 137.90 before correcting higher.
Looking at the 5 minutes chart below, the corrective move to the upside after the initial low at 137.90, stalled right near the 38.2% retracement at 138.515 of the move down from yesterday's high (see yellow area on the 5 minutes chart below). The inability to get above the 38.2% retracement was another clue that the sellers were in control.
The run to the downside resumed with a stall near the 100 day MA and a lower channel trend line near 137.57. After a brief stall at the dual level, the trend selling resumed and did not stop until reaching the recent low 136.364.
From the high near the close yesterday to the recent low, the move was around 313 pips. Not bad in a short period of time.
What now?
Looking at the hourly chart, the move to the low has been able to get below the swing lows from early July between 136.85 and 137.248. That area (see lower yellow area on the hourly chart above) is now close risk.
A more conservative risk level would be the 100 day moving average at 137.574. The last time the price traded below its 100 day moving average before today's break was back on March 16.
It would take a move back above that 100 day moving average to hurt the bearish bias.
Sellers are in control.
Trading analysis offered by RobotFX and Flex EA.
Source #RobotFX Team
Comments
Post a Comment