
Bitcoin halts its rally, but bullish bias intact above 23,438

#

Bitcoin was trading in the red at 23,736 on the H4 at the time of writing. The price climbed as much as 24,445 where it has found resistance. In the short term, it could come back to test and retest the near-term support levels before jumping higher.

In the last 24 hours, BTC/USD is down by 1.16% but it's still up by 3.47% in the last 7 days. Technically, after its amazing rally, a minor retreat or an accumulation is natural.

BTC/USD Attracts More Buyers!

analytics62e42015cfb71.jpg

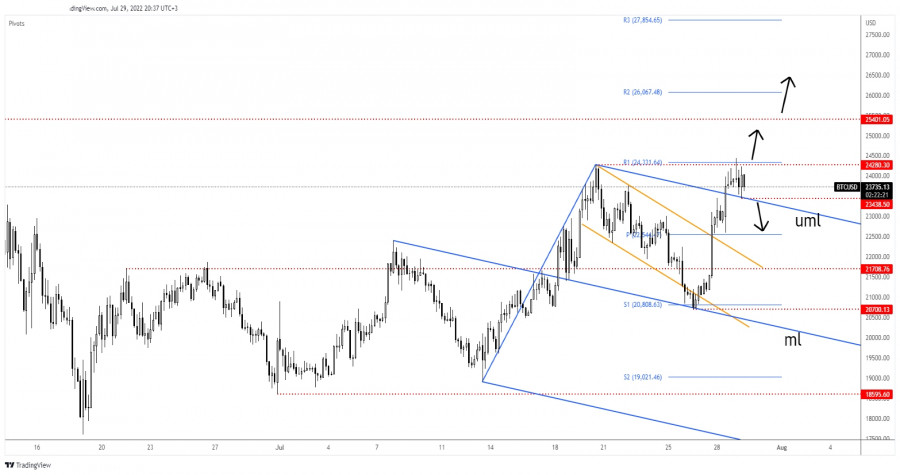
BTC/USD extended its growth and now is located above the upper median line (uml) which represented an upside obstacle. Stabilizing above this broken dynamic resistance may announce further growth.

The 24,280 former high represents a static resistance. Also, the R1 (24,331) stands as an upside obstacle. The bias is bullish as long as it stays above the 23,438 today's low.

BTC/USD Outlook!

Making a valid breakout above 24,280 could activate more gains and could bring long opportunities with a first upside target at 25,401.


Trading analysis offered by RobotFX and Flex EA.
Source #RobotFX Team

Comments

Popular posts from this blog

GBPUSD up and down. Back down testing 61.8% and swing area.

# GBPUSD tests 61.8% and swing area The GBPUSD is in an up and down day. The    GBPUSD  moved higher earlier. That move was helped by better than expected retail sales. However the high price today stalled near the high price from last week near 1.3643, and rotated back lower on the USD buying. The subsequent move lower now has the price back toward the 61.8% retracement along with a swing area between 1.35969 and 1.36034. As I type, the price has dipped below that swing area. What next? If the price can stay below the 1.36034 area, that would be the best case scenario for the sellers with the next major targets coming in at the 100 hour moving average 1.3569 (blue line), and the 200 hour moving average at 1.35609 (green line). The 50% midpoint of the 2022 trading range is just below those levels at 1.35526 and would be a another target on further weakness. A move back above 1.36034 with momentum would have traders looking again toward 1.3618 to 1.36271 and then t...