The USD/JPY pair dropped after failing to stay above the 136.71 key resistance. Now, it was traded at 135.90 at the time of writing. Technically, the price dropped below strong near-term downside obstacles signaling a potential deeper drop.
Unfortunately, the Dollar Index plunged, that's why the USD started to depreciate. On the other hand, the JPY appreciated versus its rivals as the Yen Futures rallied. USD/JPY dropped even if the Japanese Prelim Industrial Production dropped by 7.2% versus the 0.2% drop expected, while the Housing Starts dropped by 4.3% even if the traders expected a 1.7% growth.
Fundamentally, the greenback took a hit from the US data. Core PCE Price Index, Unemployment Claims, Personal Spending, and Chicago PMI came in worse than expected.
USD/JPY Sell-off!
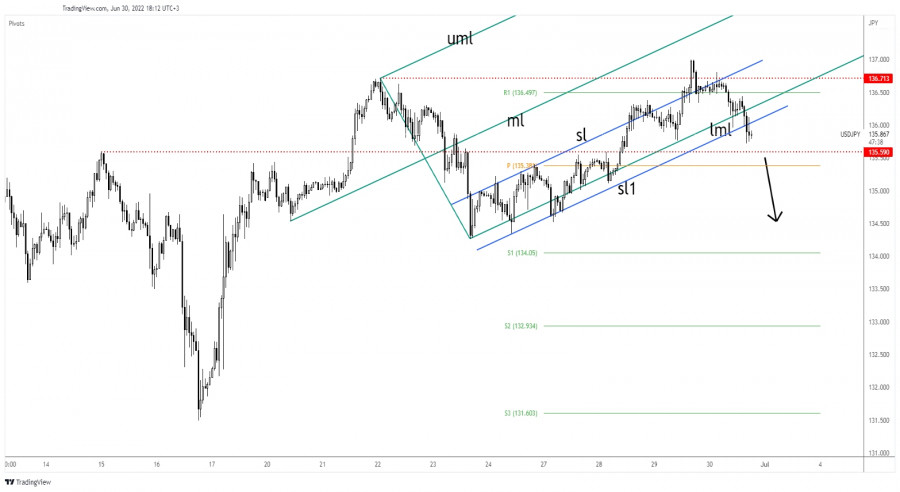
USD/JPY failed to stay above 136.71 higher high, signaling exhausted buyers. It has registered only false breakouts, so the upward movement could be over for now. Also, it has failed to stay above the inside sliding line (sl) which represented a dynamic resistance.
Now, it has dropped below the outside sliding line (sl1) which was seen as a dynamic support. The 135.59 key level represents a critical downside obstacle.
USD/JPY Outlook!
Testing and retesting the outside sliding line (sl1) followed by a valid breakdown below 135.59 could activate more declines. Dropping and stabilizing below this key level and under the weekly pivot point of 135.38 could bring new selling opportunities.
Trading analysis offered by RobotFX and Flex EA.
Source #RobotFX Team
Comments
Post a Comment