The USD/CHF pair plunged in the last hours as the US dollar Index turned downside after the US economic data. When DXY drops, the USD/CHF pair could also drop. Still, please keep in mind that the US dollar Index maintains a bullish bias despite temporary declines.
Fundamentally, the Swiss Franc received a helping hand from Switzerland's economic data. The Retail Sales dropped by 1.6% versus the expected 5.0%, while the KOF Economic Barometer came in at 96.9 points above the expected 96.2.
As I've said above, USD was punished by the US Core PCE Price Index which increased by 0.3% versus 0.4%. Unemployment Claims came in at 231K, failing to reach the 228K estimates. In addition, Personal Spending surged by 0.2%, which is below the forecast of 0.4%, while the Chicago PMI dropped from 60.3 points to 56.0 points, far below the estimated level of 58.1.
USD/CHF Trading In The Red
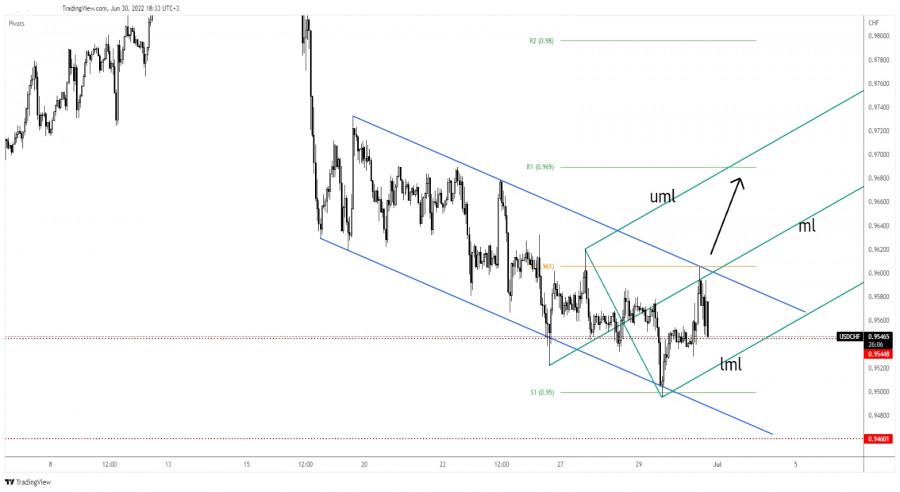
From the technical point of view, the rate is trapped within a downward channel pattern. As long as it stays under this line, the rate could drop deeper. The 0.9544 key level (historical level) serves as an immediate downside obstacle. Also, the lower median line (lml) of the ascending pitchfork represents dynamic support.
In the short term, the pressure will remain high after testing the confluence area formed at the intersection between the pivot point of 0.9610 with the downtrend line and after registering a false breakout above the pitchfork's median line (ml).
USD/CHF Forecast
Only a valid breakout above the downtrend line, above the pivot point of 0.9610, and above the median line (ml) could bring a new buying opportunity. As long as it stays under the downtrend line, we can still look for new selling opportunities.
Breaking below the lower median line (lml) and making a new lower low brings new selling signals.
Trading analysis offered by RobotFX and Flex EA.
Source #RobotFX Team
Comments
Post a Comment