Technical outlook:
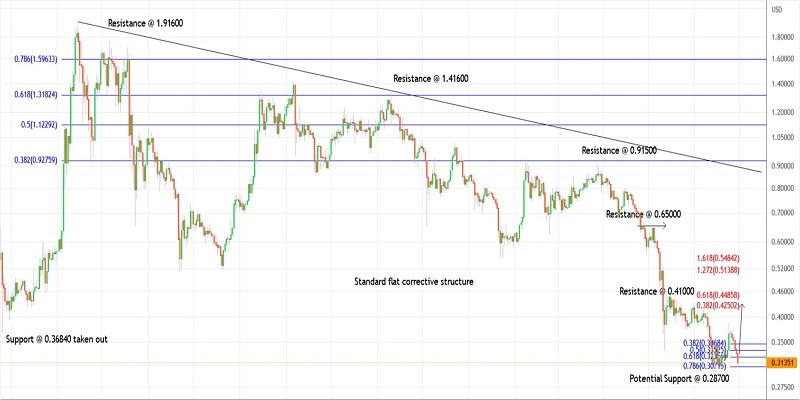
Ripple dropped through the $0.30500 lows intraday on Thursday before finding support and pulling back. The crypto is seen to be trading at around $0.31500 at this point in writing and is expected to resume higher towards $0.44800 at least in the next few trading sessions. Bulls need to hold prices above the $0.28700 interim support to keep the structure intact.
Ripple has carved a larger degree corrective drop between $1.91600 and $0.28700 in the past several months. The above zigzag might have been complete and it could be the first wave of a much deeper correction below $0.28700 in the coming months. Ideally, a corrective rally should unfold towards $0.92750 at least before the next leg resumes lower.
Ripple has also carved a lower degree upswing between $0.28700 and $0.38700 in the past few trading sessions as the first step towards the proposed corrective rally. Furthermore, prices have also retraced towards $0.30500, which is close to the Fibonacci 0.786 level of the above upswing. The high probability remains for a bullish turn from here.
Trading plan:
Potential rally towards $0.44800 against $0.28700
Good luck!
Trading analysis offered by RobotFX and Flex EA.
Source #RobotFX Team
Comments
Post a Comment