Technical outlook:
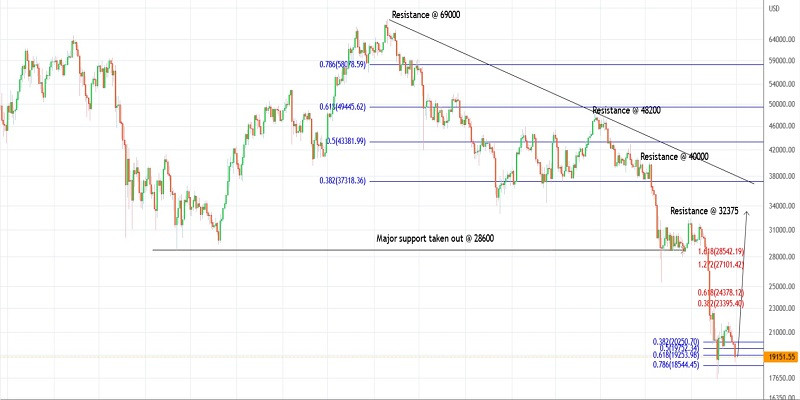
Bitcoin prices have dropped through the $18,700 low intraday on Thursday as projected earlier. The crypto has pulled back above the $19,100 mark at this point of writing as bulls are now poised to push prices towards the level of $24,300 and $28,500. They will need to hold prices above the $17,500 interim low to keep the structure constructive.
Bitcoin is now working on its larger degree downswing between $69,000 and $17,500 as discussed earlier. The drop has unfolded into a zigzag corrective structure (5-3-5) and needs to be retraced towards at least $37,300 and up to $49,500. If the above-proposed structure holds well, bulls will be back in control from here.
Bitcoin has also carved its lower degree upswing between the levels of $17,500 and $21,800 in the past few trading sessions. Furthermore, prices have now dropped through the $18,700 level, which is just below the 0.618 Fibonacci retracement of the above upswing. Ideally, bulls are expected to be soon back in control from here and push at least through the $24,300 level.
Trading plan:
Potential rally towards $24,300 and $28,500 against $17,500
Good luck!
Trading analysis offered by RobotFX and Flex EA.
Source #RobotFX Team
Comments
Post a Comment