Ripple is trading in the red at 0.3252 on the H1 at the time of writing. The bias remains bearish, so we cannot exclude more declines if BTC/USD drops deeper. Still, it remains to see what will really happen as the rate reached a strong confluence area.
XRP/USD dropped by 9.56% from yesterday's high of 0.3536 to 0.3197 today's low. The altcoin is at crossroads, it could bring new opportunities soon.
XRP/USD Long or Short?
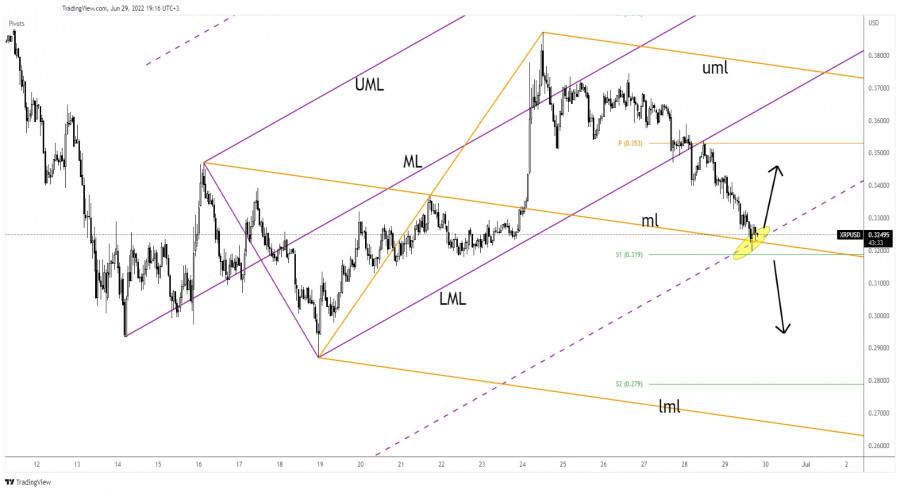
As you can see on the H1 chart, XRP/USD dropped deeper after retesting the weekly pivot point of 0.3530 and the ascending pitchfork's lower median line (lml). Now it has found support on the ascending pitchfork's warning lien (wl1) and on the descending pitchfork's median line (ml).
Technically, we have a strong confluence area at the intersection between these downside obstacles. Personally, I'll wait for either a valid breakdown or a false breakdown before taking action.
Ripple Prediction!
A valid breakdown through the confluence area, a new lower low, dropping and closing below the weekly S1 (0.3190) could activate more declines and could bring new short signals.
A false breakdown through the confluence area may announce a new bullish momentum.
Trading analysis offered by RobotFX and Flex EA.
Source #RobotFX Team
Comments
Post a Comment