The GBP/USD pair is extending its sideways movement. I'll wait for the rate to escape this pattern before going long or short. The price dropped a little after reaching the 1.2331 level but the retreat ended as the Dollar Index's drop weakened the USD.
Fundamentally, the USD remains sluggish in the short term after the Flash Services PMI and the Flash Manufacturing PMI reported worse than expected data on Thursday signaling a slowdown in expansion in both sectors. On Friday, the US and UK data came in mixed.
Today, the US Durable Goods Orders, Core Durable Goods Orders, and Pending Home Sales reported a 0.7% growth each, beating expectations but the USD is still in a corrective phase in the short term versus its rivals.
GBP/USD Range Pattern!
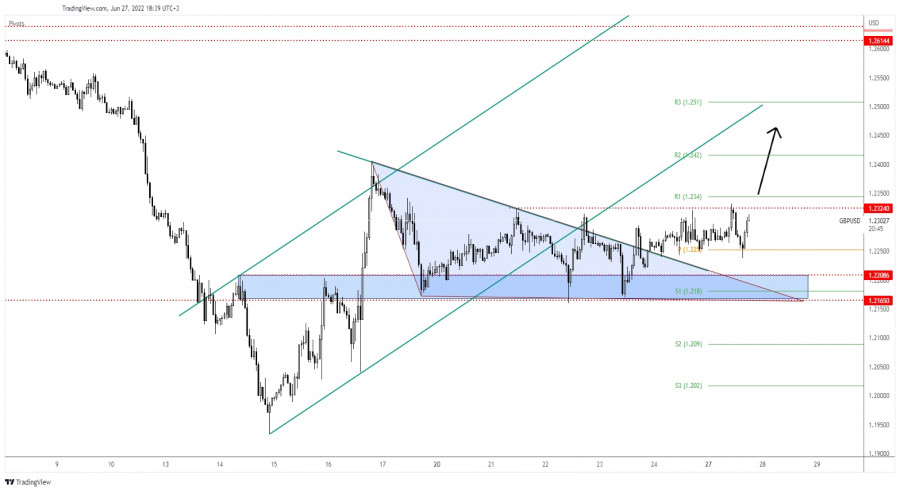
GBP/USD is trapped between 1.2324 and 1.2165. The 1.2208 - 1.2165 support area held so the rate came back higher towards the 1.2324 static upside obstacle. The price escaped from the triangle pattern signaling strong upside pressure.
After escaping from the up-channel pattern, the GBP/USD pair signaled a potential strong drop. Still, its failure to make a new lower low invalidated a larger sell-off. In the short term, it could continue to move sideways as the Dollar Index moves sideways as well.
GBP/USD Outlook!
The weekly R1 (1.2340) is seen as a crucial upside obstacle. A valid breakout above this level activates an upside continuation. This scenario could bring new long opportunities with a potential upside target at the uptrend line.
Trading analysis offered by RobotFX and Flex EA.
Source #RobotFX Team
Comments
Post a Comment