The price of Bitcoin plunged in the short term and it seems very heavy after failing to confirm a larger rebound. It was traded at 20,722 at the time of writing. BTC/USD dropped by 5.91% from 21,868 yesterday's high to 20,575 today's low.
Technically, the crypto could move sideways in the coming period, but you should keep in mind that the bias remains bearish. In the last 24 hours, BTC/USD is down by 3.0% but it's still up by 0.98% in the last 7 days.
BTC/USD Bears In Control!
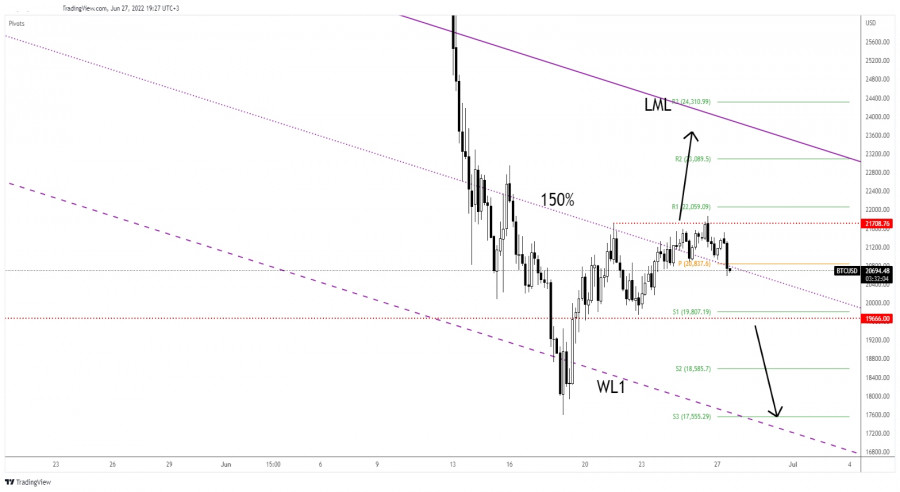
BTC/USD challenges the 150% Fibonacci line and the weekly pivot point of 20,837. These are seen as downside obstacles. As you can see on the H4 chart, the rate found resistance at 21,708 again. It has registered only a fasle breakout through this upside obstacle signaling that the upside movement is over.
It's trapped between 21,708 and 19,666 levels. In the short term, it could come back down to test and retest the immediate downside obstacles.
BTC/USD Outlook!
Stabilizing below the pivot point (20,837) and under the 150% Fibonacci line may activate a deeper drop towards the S1 (19,807) and down to the 19,666 key level. As you already know from my analyses, only a valid breakout above the 21,708 could activate an upside continuation.
Trading analysis offered by RobotFX and Flex EA.
Source #RobotFX Team
Comments
Post a Comment