Bitcoin plunged in the short term after failing to take out the resistance represented by 21,708. Now, it is traded at the 20,052 level at the time of writing. Cryptocurrency stands right above a strong downside obstacle.
BTC/USD dropped by 3.00% from today's high of 20,440 to 19,827 today's low. In the short term, it has changed little. Technically, Bitcoin could move somehow sideways in the short term before developing a strong move in one direction.
BTC/USD Trapped Within A Range!
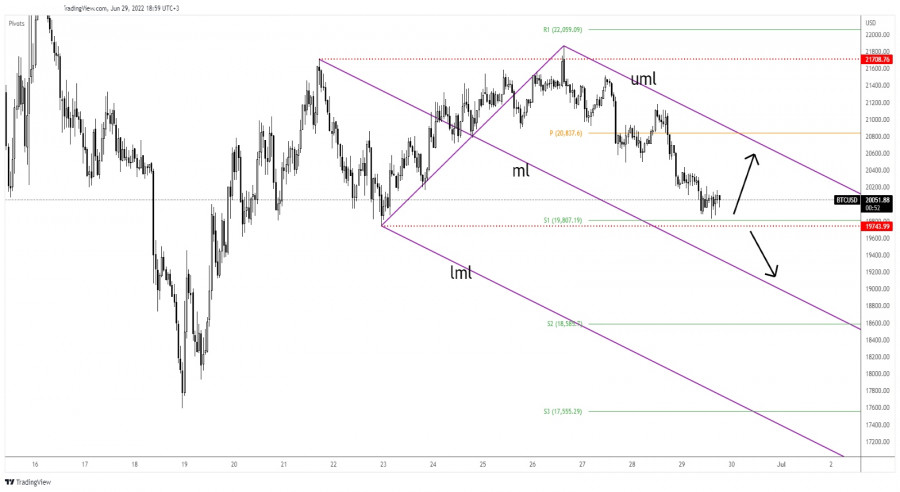
It's trapped between 21,708 and 19,743 levels. Now, it's almost to hit the 19,743 downside obstacle. Personally, I've drawn a descending pitchfork hoping that I'll catch a new sell-off. In the short term, the bias remains bearish as long as it stands below the upper median line (uml).
Bitcoin could bring new opportunities from around the 19,743 former low. It remains to see how it will react. The bias is bearish, so personally, I will look for potential short opportunities.
BTC/USD Forecast!
Failing to stabilize above the weekly pivot point of 20,837 followed by a new lower low, dropping and closing below 20,491 activated more declines and helped the sellers to catch a larger drop.
A valid breakdown below 19,743 could open the door for a downside continuation at least towards the median line (ml). Only false breakdowns through 19,743 could signal a new bullish momentum in the short term.
Trading analysis offered by RobotFX and Flex EA.
Source #RobotFX Team
Comments
Post a Comment