The USD/CHF pair climbed as high as 0.9620 today where it has found resistance. Now, it is trading at 0.9585 at the time of writing. Unfortunately, the price action failed to confirm the breakout through the downtrend line signaling that the bearish bias remains intact.
In the short term, the pair rebounded only because the Dollar Index bounced back. Today, Switzerland's economic data came in mixed. The GDP rose by 0.5% beating the 0.3% estimates, Retail Sales reported a 6.0% drop versus 1.4% forecasted, while the Trade Balance came in at 4.13B versus 3.50B expected.
Surprisingly or not, the USD/CHF pair is trading in the red even though the US CB Consumer Confidence, Chicago PMI, and the S&P/CS Composite-20 HPI came in better than expected. Only the HPI reported worse than expected data after reporting only a 1.2% growth versus 2.0% expected.
USD/CHF Breakout!
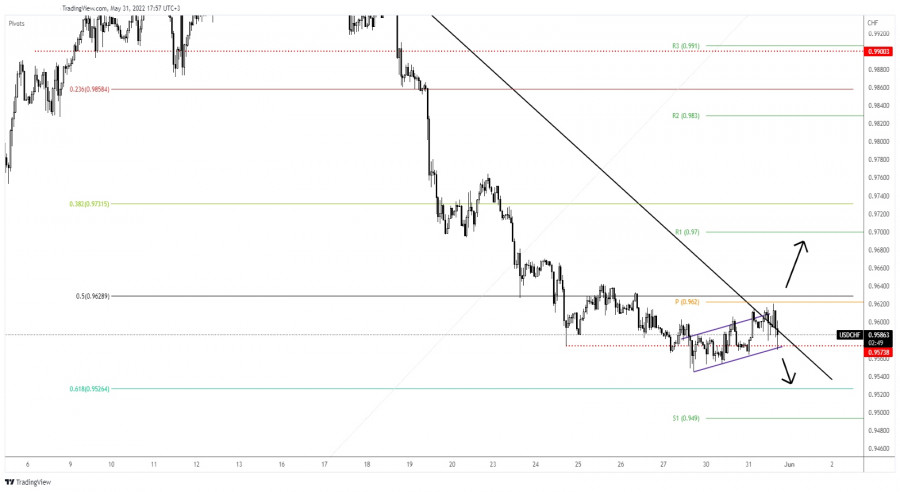
You knew from my last analysis that the USD/CHF pair could resume its drop as long as it stays under the downtrend line. The price action registered only a false breakout above this dynamic resistance signaling more declines.
As you can see on the H1 chart, the price is still trapped within the minor up-channel pattern. This flag formation could activate a downside continuation. Only validating its breakout above the downtrend line could invalidate a downside continuation.
USD/CHF Outlook!
Dropping and closing below 0.9563 could activate the flag formation and could bring new selling opportunities.
On the other hand, staying above 0.9573 and making a new higher high, a bullish closure above 0.9620 today's high could activate a larger growth.
Trading analysis offered by RobotFX and Flex EA.
Source #RobotFX Team
Comments
Post a Comment