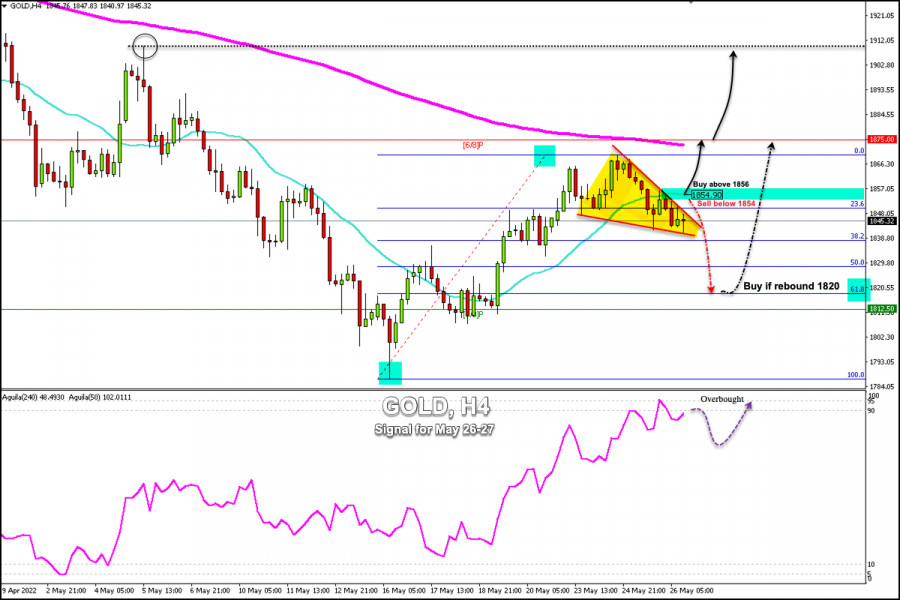
Trading Signal for Gold (XAU/USD) on May 26-27, 2022: sell below $1854 (21 SMA - symmetrical triangle)
Gold (XAU/USD) is extending the pullback from the highs of 1,870, while the US dollar is holding on to small recovery gains amid an environment of cautious risk. The US dollar index is trading at 101.94.
The convergence of the 23.6% Fibonacci retracement on the 4-hour chart located at 1,851 and the 21 SMA at 1,854.90 are the immediate barrier.
On the 4-hour chart, we can see the formation of a symmetrical triangle. A sharp break above this triangle could cement the bullish strength of gold, but for this, it should consolidate above the pivot point of 1,854.
On the other hand, a break below the Fibonacci 38.2% around 1,838 could accelerate the bearish move and it could drop towards the Fibonacci 61.8% around 1,820.
The 61.8% Fibonacci level will be a good opportunity for the bulls to buy in the short term and the price could reach the zone of 1,875 and even 1,910.
On the other hand, if gold manages to consolidate and make a daily close above the 21 SMA located at 1,854, it may continue its uptrend and it could reach the high of 1,870 and even reach the EMA 200 and 6/8 Murray that converge around 1,875.
Our trading plan for the next few hours is to wait until gold tests the zone of 1,855. If the price breaks sharply and consolidates above this zone, it will be an opportunity to buy with targets at 1,875. On the contrary, if gold fails to consolidate above this level, we can sell with targets at 1,840 and 1,820.
Since May 24, the eagle indicator has entered an overbought zone. Gold is likely to take advantage of this small correction that is taking place in order to resume its uptrend. However, we must wait for confirmation above 1,855 to buy.
Trading analysis offered by RobotFX and Flex EA.
Source #RobotFX Team
Comments
Post a Comment