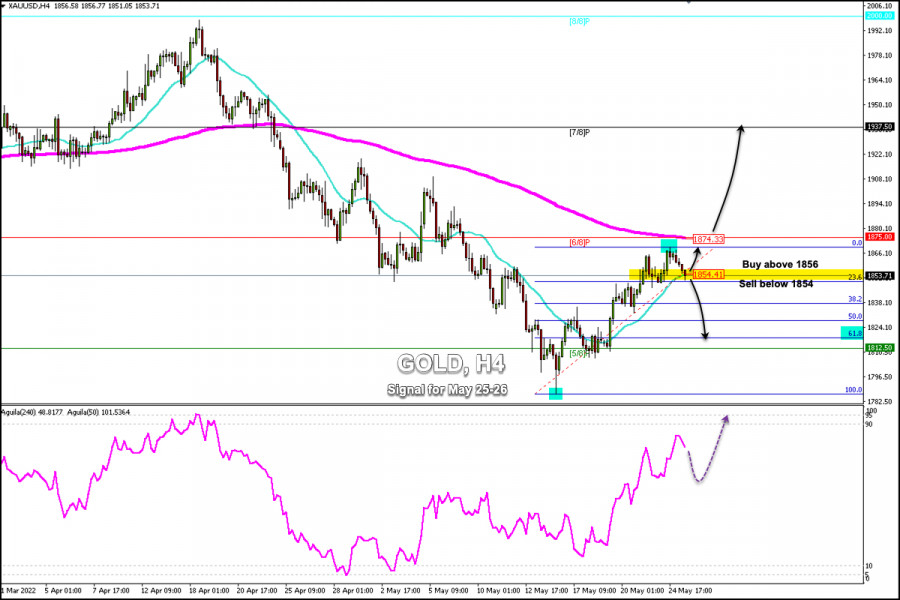
Early in the American session, Gold (XAU/USD) is trading around the 21 SMA located at 1,854. After having reached a high in the zone 1,869.55, gold is pulling back and is likely to continue its downtrend and could reach the 61.8% Fibonacci level.
Gold has a strong barrier at 6/8 Murray (1,875), where the 200 EMA is additionally located. If the price trades back above 1,856 or around this level, it will act as a strong top.
If the Fed minutes are followed by a positive market reaction, traders should watch for gold to retest the zone 5/8 Murray at 1,812.
The US dollar (USDX) has reversed some of the losses when it hit 101.63. This, in turn, has been considered a key factor weighing on gold prices.
According to the 4-hour chart, gold is at a key point of 1,855. If gold consolidates below this level in the next few hours, it is likely to continue its downward movement and could reach the 38.2% Fibonacci level at around 1,840. In case the downward pressure prevails, the metal could reach the zone 61.8% around 1,818.
Conversely, if gold consolidates above 1,856, it will be a signal to buy, with targets at 1,865 and 1,875. Additionally, a daily close above the 200 EMA and above 6/8 Murray we could expect a bullish movement that could push the price up to 7/8 Murray at 1,937.
Our trading plan for the next few hours is to sell below 1,854 (21 SMA), with targets at 1,841 and 1,820. The eagle indicator is giving a negative signal and a technical correction is likely to occur first for the uptrend to resume.
Trading analysis offered by RobotFX and Flex EA.
Source #RobotFX Team
Comments
Post a Comment