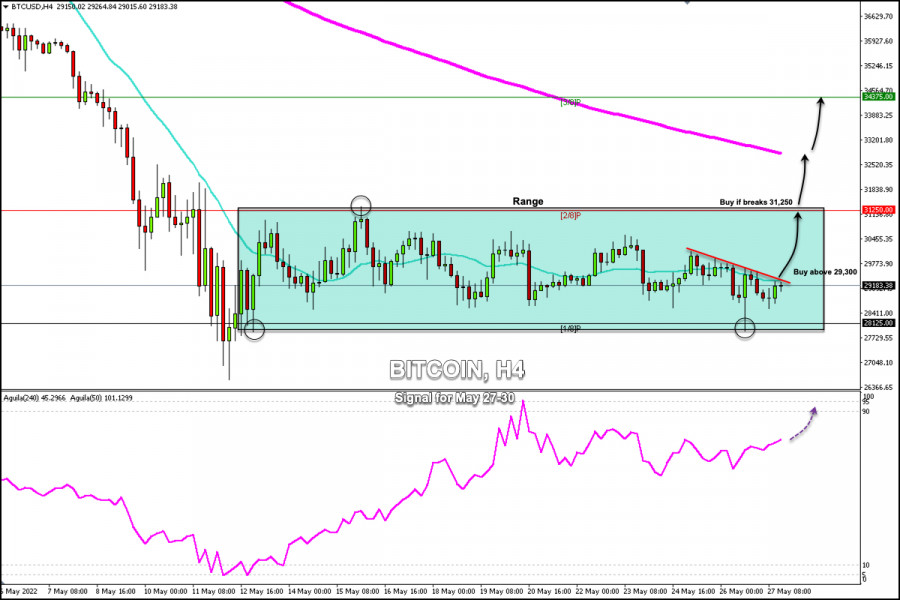
Early in the American session, the price of Bitcoin (BTC/USD) is trading at 29,183, recovering from the fall of May 26 that was as deep as 27,910.
According to the 4-hour chart, we can see a downtrend channel formed since May 23. Besides, Bitcoin is trading below the 21 SMA which has become a strong resistance in the short term.
If Bitcoin manages to break 21 SMA and the top of the bearish channel in the next few hours and consolidates above 29,300, it would mean a bullish advance so that the price could reach the top of the range around 2/8 Murray at 31,250.
Conversely, as long as BTC trades below the 21 SMA at 29,200, we should avoid buying as it is likely to drop to the zone 1/8 Murray again around 28,125.
On the other hand, in the event that Bitcoin breaks out of the range zone formed on May 12 and consolidates above 2/8 Murray, the bullish force could accelerate and BTC could reach 200 EMA at 32,700 and even 3/8 Murray at 34,375.
Our trading plan for the next few hours is to wait for a break above 29,300 to buy, with targets at the psychological level of 30,000 and 2/8 Murray at 31,250. The eagle indicator is giving a positive signal which supports our bullish strategy.
Trading analysis offered by RobotFX and Flex EA.
Source #RobotFX Team
Comments
Post a Comment