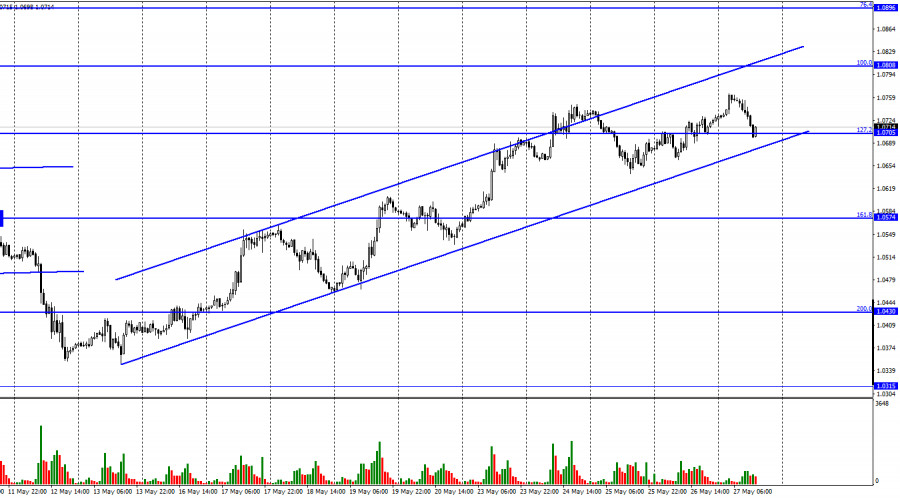
Hi, dear traders! On Thursday, EUR/USD continued to move upwards and closed above the retracement level of 127.2% (1.0705). However, the pair reversed downwards on Friday and fell to the bottom boundary of the trend channel. The ascending trend channel indicates bullish sentiments among traders. If EUR/USD settles below this channel, it could then fall towards the retracement level of 161.8% (1.0574). Over the past 2 weeks, the euro's situation has markedly improved. EUR/USD closed in positive territory almost every day. However, the recent upturn is very likely only a correction - these gains do not match economic reports. The daily chart shows that EUR has retraced upwards after a long downtrend. From time to time, these upward corrections are supported by data releases.
Earlier, the euro ignored positive data during its downward trend of the past two months. Currently, the downturn could resume in the near future. Alternatively, the pair could enter a sideways trend. The rhetoric of the ECB and its president Christine Lagarde has become more hawkish recently. The regulator now plans to increase interest rates in summer and autumn of 2022. However, these increases are not particularly large, especially when compared with the Federal Reserve's plans to hike interest rates by 1% at its next two policy meetings. The euro receives very limited support from Lagarde and the ECB, which again indicates that EUR could once again fall in the near future. No events have influenced the trading session early on Friday, with traders opening both long and short positions.
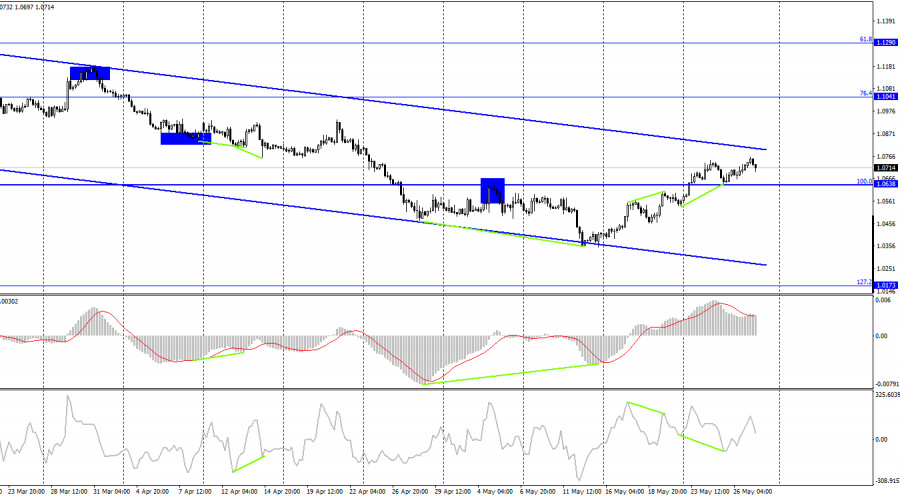
According to the H4 chart, the pair bounced off the retracement level of 100.0% (1.0638) upwards and formed a bullish CCI divergence. EUR/USD continues to move upwards towards the Fibo level of 76.4% (1.1041). However, the pair remains within its descending trend channel, indicating that trader sentiment remains bearish. As stated above, the pair's upturn could likely be a correction - EUR/USD remains in a downtrend on the H4 chart.
Commitments of Traders (COT) report:
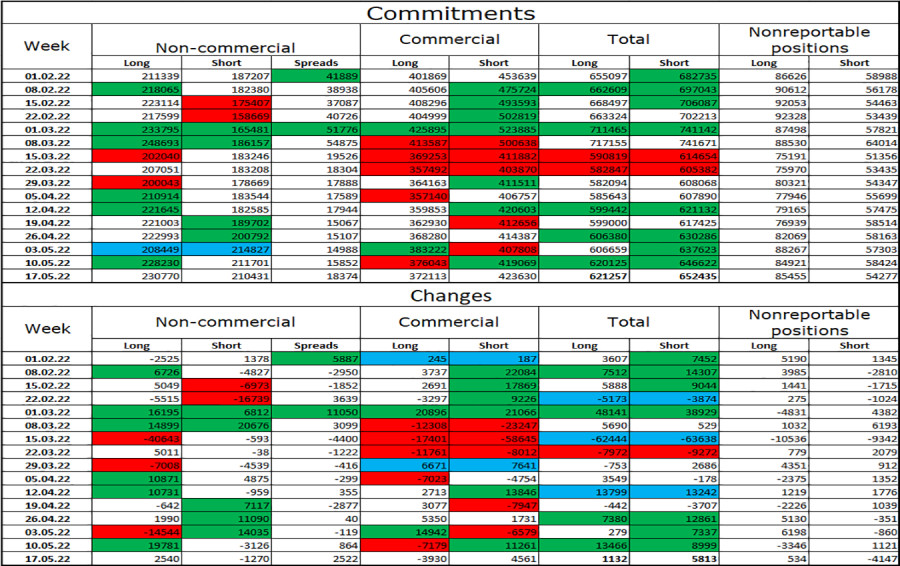
Last week, traders opened 2,540 Long positions and closed 1,270 Short positions, indicating an increasingly bullish sentiment in the market. The total number of open Long positions is not 230,000 against 210,000 Short positions. The gap between Open and Short positions is quite small and does not match the prolonged downward trend of EUR/USD. The European currency has been sliding down, despite the bullish trader sentiment. The situation remains roughly the same this week, with trader positioning not matching the actual situation in the market.
US and EU economic calendar:
US - Personal income data (12-30 UTC).US - Personal consumption expenditures (PCE) data (12-30 UTC).US - Goods trade balance (12-30 UTC).
USD had advanced early on Friday before US data releases were published. These reports can slightly influence traders throughout the day. There are no economic events in the EU today.
Outlook for EUR/USD:
Traders are recommended to open short positions if EUR/USD closes below the trend channel on the H1 chart, with 1,0574 being the target. Long positions can be opened if the pair settles above the price channel on the H4 chart, targeting 1.1041.
Trading analysis offered by RobotFX and Flex EA.
Source #RobotFX Team
Comments
Post a Comment