As of this writing, AUD/USD is trading near 0.7190, up 32 pips from last week's closing price. The pair maintains positive momentum, tending towards key resistance levels 0.7240 (144 EMA on the daily chart), and 0.7270 (200 EMA on the daily chart).
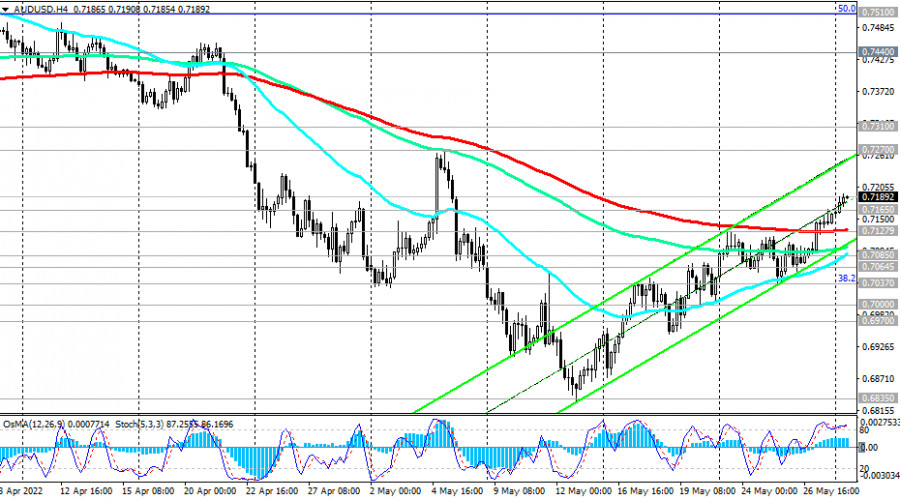
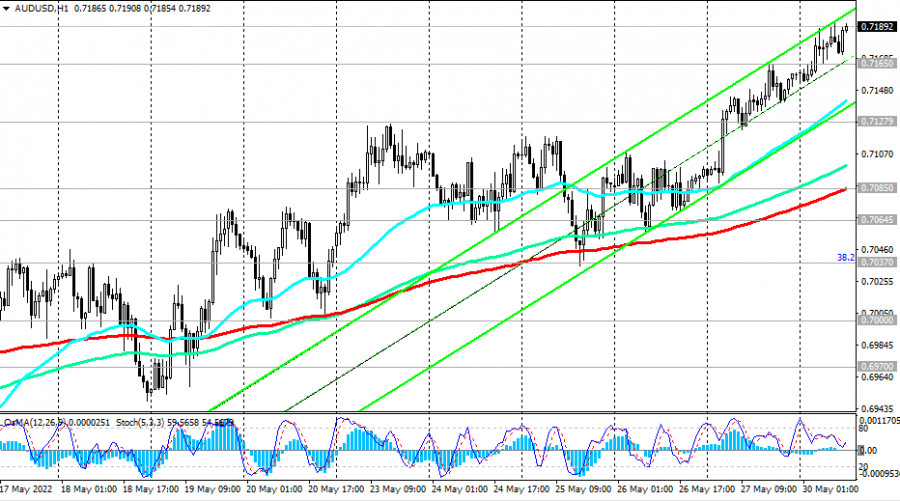
Trading below these key resistance levels, AUD/USD remains in the bear market zone. Therefore, the breakdown of the important support level 0.7165 (50 EMA on the daily chart) will be the first signal for the resumption of short positions, and the breakdown of the important short-term support levels 0.7128 (200 EMA on the 4-hour chart), 0.7085 (200 EMA on the 1-hour chart) will be confirming.
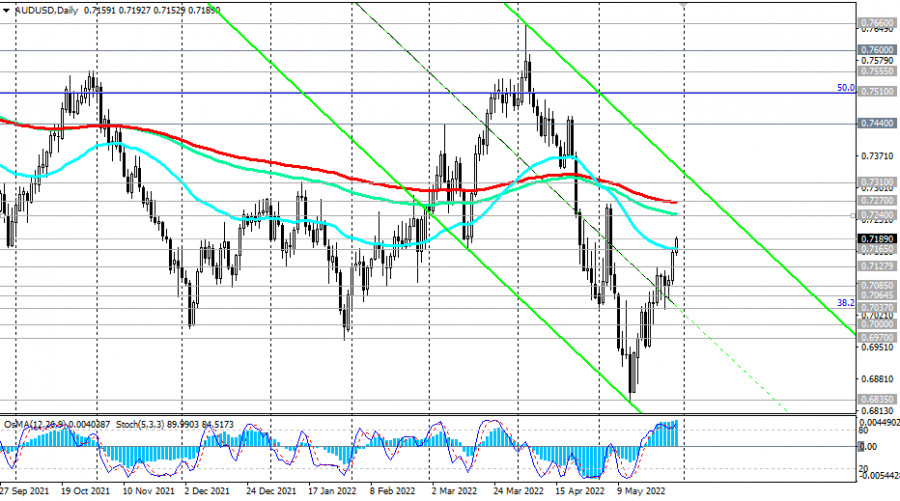
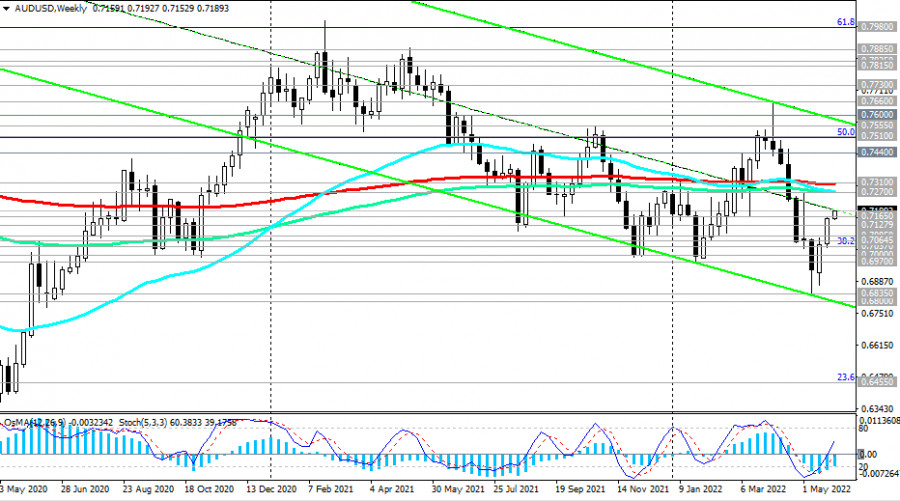
In this case, AUD/USD will head deeper into the descending channels on the daily and weekly charts, the lower limit of which is near the 0.6800 mark.
In the alternative scenario, AUD/USD will continue corrective growth towards the resistance levels of 0.7240, 0.7270. Further growth and breakout of the key resistance level 0.7310 (200 EMA on the weekly chart, 50 EMA on the monthly chart) create prerequisites for growth to the long-term resistance level of 0.7600 (200 EMA on the monthly chart), which separates the long-term bull market from the bear market. A breakdown of the resistance level of 0.7650 (144 EMA on the monthly chart) may finally bring AUD/USD into the zone of a long-term bull market.
Support levels: 0.7165, 0.7128, 0.7085, 0.7064, 0.7037, 0.7000, 0.6970, 0.6800, 0.6450
Resistance levels: 0.7200, 0.7240, 0.7270, 0.7310, 0.7400, 0.7440, 0.7510, 0.7555, 0.7600, 0.7650
Trading Tips
Sell Stop 0.7145. Stop-Loss 0.7210. Take-Profit 0.7128, 0.7085, 0.7064, 0.7037, 0.7000, 0.6970, 0.6800, 0.6450
Buy Stop 0.7210. Stop-Loss 0.7145. Take-Profit 0.7240, 0.7270, 0.7310, 0.7400, 0.7440, 0.7510, 0.7555, 0.7600, 0.7650
Trading analysis offered by RobotFX and Flex EA.
Source #RobotFX Team
Comments
Post a Comment