The USD/JPY pair climbed as much as 126.68 today. It has resumed its growth as expected as the Dollar Index is bullish while the Yen Basket maintains a bearish bias! You knew from my previous analysis that the currency pair could extend its growth as long as it stays above the 125.10 key level and above the uptrend line.
So, the bias is bullish, but it remains to see how it will react later after the US data. Poor economic figures could force the Dollar Index to retreat. The Empire State Manufacturing Index could be reported at 0.9 points versus -11.8 in the previous reporting period. In addition, the Capacity Utilization Rate could be reported at 77.8%, while Industrial Production may report a 0.4% growth in March.
USD/JPY Targeting New Highs!
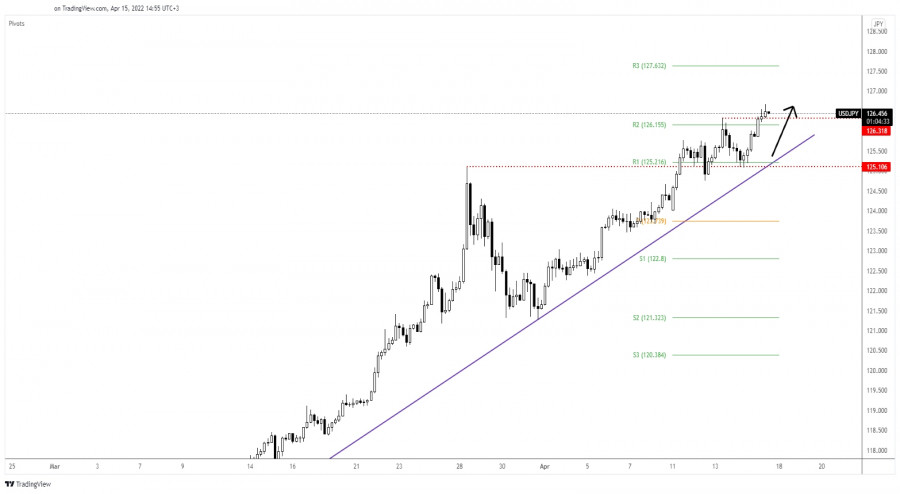
USD/JPY tested and retested the 125.10 former high before resuming its growth. Its failure to reach and retest the uptrend line signal that the buyers are very strong in the short term. Now, it has passed above the weekly R1 (126.15) and above the 126.31 former high.
Taking out these upside obstacles signals that the USD/JPY could resume its growth. Better than expected US data could boost the USD, so the pair could approach and reach new highs.
USD/JPY Outlook!
Validating the current breakout, testing, and retesting 126.31 could confirm more gains and could bring new buying opportunities with the first upside target at the 127.00 psychological level.
Trading analysis offered by RobotFX and Flex EA.
Source #RobotFX Team
Comments
Post a Comment