
Solana short-term analysis.

#

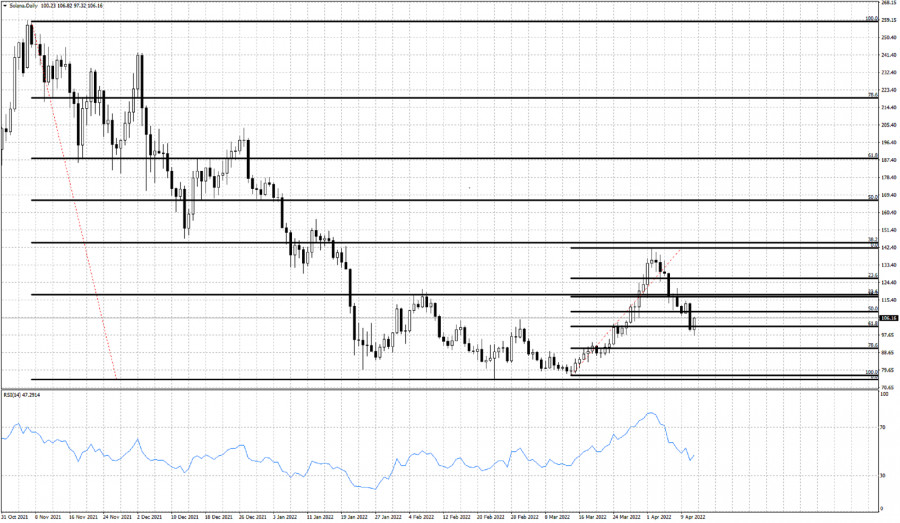
Solana has made a low around $97.32 and is now bouncing higher. Price is now at $107 and Solana seems to have formed a higher low at a key Fibonacci retracement level. In our last analysis when Solana price was challenging horizontal support at $116-$117, we warned traders that a break below that horizontal support would lead price towards $98.

analytics6255795516a52.jpg

Black lines- Fibonacci retracements

Solana has reached our second pull back target. Price has retraced 61.8% of the upward move from 476 to $142. Price has made a higher low and bulls must now defend it. If the higher low is not violated downwards, we should expect Solana to challenge the recent highs at $142-$143. Breaking above this level will push Solana price towards the 61.8% retracement of the entire decline at $187.


Trading analysis offered by RobotFX and Flex EA.
Source #RobotFX Team

Comments

Popular posts from this blog

GBPUSD up and down. Back down testing 61.8% and swing area.

# GBPUSD tests 61.8% and swing area The GBPUSD is in an up and down day. The    GBPUSD  moved higher earlier. That move was helped by better than expected retail sales. However the high price today stalled near the high price from last week near 1.3643, and rotated back lower on the USD buying. The subsequent move lower now has the price back toward the 61.8% retracement along with a swing area between 1.35969 and 1.36034. As I type, the price has dipped below that swing area. What next? If the price can stay below the 1.36034 area, that would be the best case scenario for the sellers with the next major targets coming in at the 100 hour moving average 1.3569 (blue line), and the 200 hour moving average at 1.35609 (green line). The 50% midpoint of the 2022 trading range is just below those levels at 1.35526 and would be a another target on further weakness. A move back above 1.36034 with momentum would have traders looking again toward 1.3618 to 1.36271 and then t...