The price of gold is trading in the green on the H1 chart. It's located at 1,973 at the time of writing and it seems determined to resume its growth after failing to stabilize below the 1,966 key level. In the short term, it has registered a minor retreat which is natural in an uptrend.
Today, the US economic data could bring some volatility and strong moves. Industrial Production could report a 0.4% growth in March, while the Capacity Utilization Rate is expected at 77.8% versus 77.6% in the previous reporting period.
XAU/USD Range!
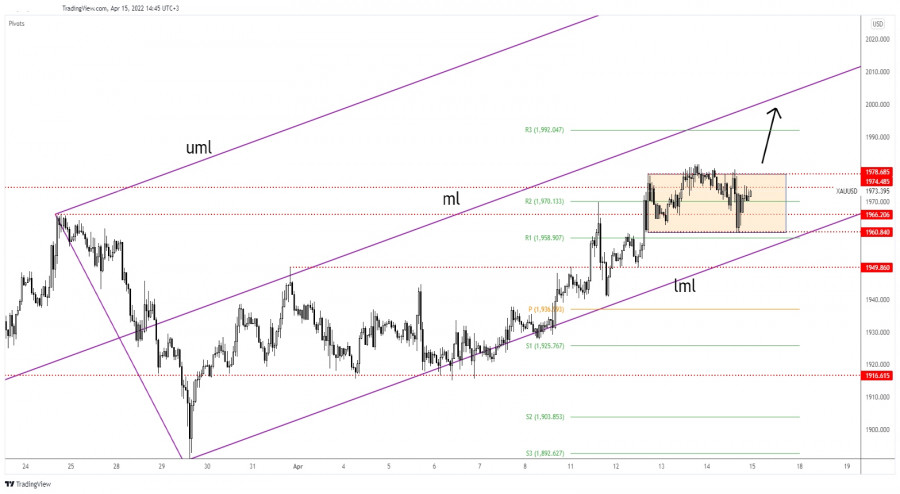
Technically, the yellow metal developed a range pattern between 1,978 and 1,960 levels. As you already know, the bias remains bullish as long as it stays above the pitchfork's lower median line (lml).
1,966 stands as strong static support. XAU/USD could climb higher after failing to make a new lower low or to stabilize under this downside obstacle.
XAU/USD Outlook!
Making a valid breakout above the 1,978 static resistance, a new higher high could signal further growth at least towards the R3 (1,992). This scenario could bring new long opportunities.
Also, please keep in mind that the median line (ml) acts as a magnet, so it could attract the price.
Trading analysis offered by RobotFX and Flex EA.
Source #RobotFX Team
Comments
Post a Comment