Bitcoin has slowed down its downtrend within a local bearish trend. However, the situation remains tense due to the fact that the asset may plummet significantly. If Bitcoin breaks through $40,000, it would open the way to the next Fibo level, which is below $37,000. Despite this, there are other options for BTC/USD price movement.
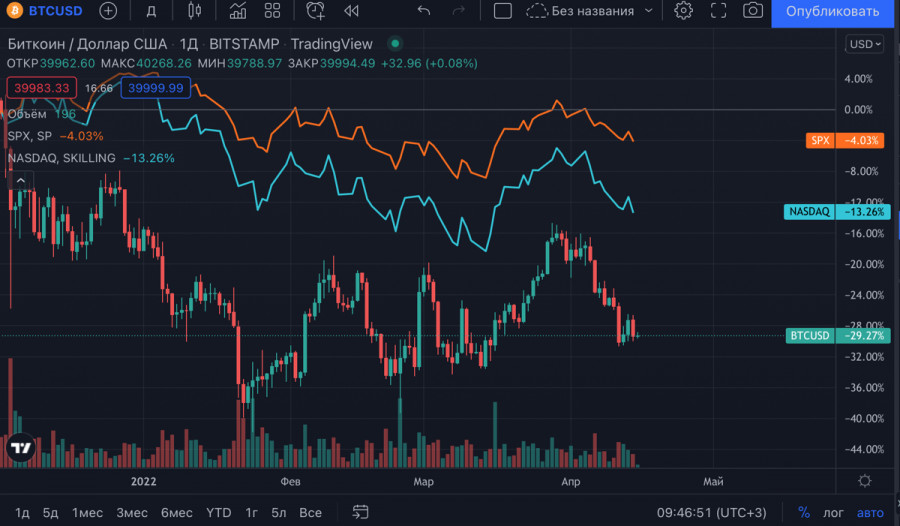
Currently, investors should take into account Bitcoin's increased correlation with stock markets. The cryptocurrency is moving in tandem with inflated stock indices like the SPX, and is likely to decline more as monetary policy tightens. In addition, there is a period of passive BTC accumulation by large investors. However, the positive trend remains due to the fact that some players and miners are locking in profits. With this in mind, the current accumulation cannot be called a purposeful increase in BTC volumes. This is rather a forced measure provoked by the emergence of free volumes that allow to average the price of the asset.
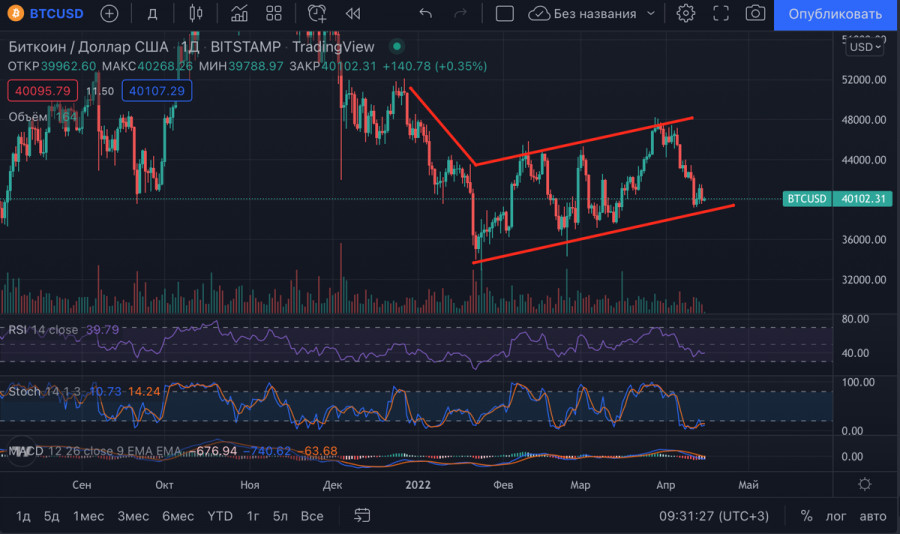
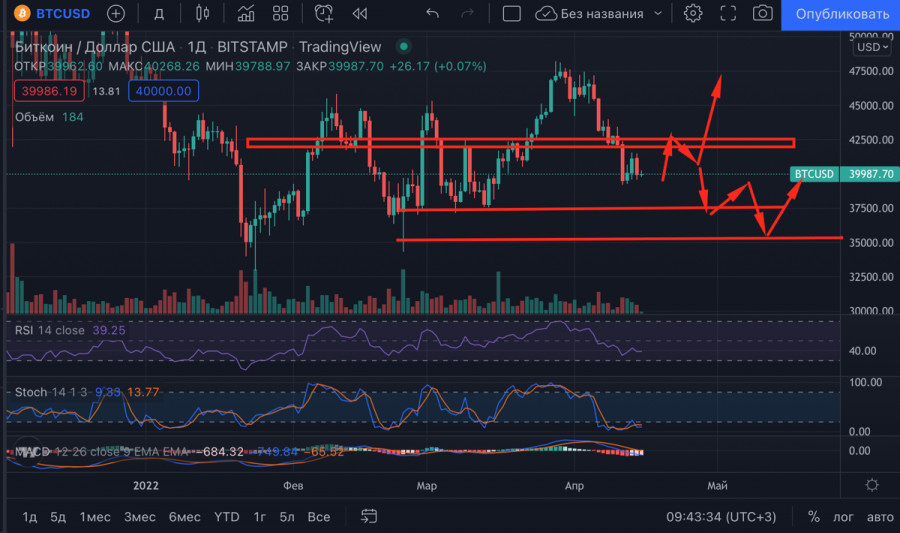
The technical picture reflects the impact of the negative fundamental background. Buying activity is low, and current volumes are barely enough to hold the price above the support of $40,000. Bitcoin has already broken through support levels of the two-week uptrend, but BTC decline below $40,000 may trigger a bigger correction. On the cryptocurrency's daily time frame, a bearish flag pattern appeared. The price managed to reach the lower boundary of this pattern, and in case the price breaks through the lower boundary of the pattern, the price may plummet to $25,000-$30,000.
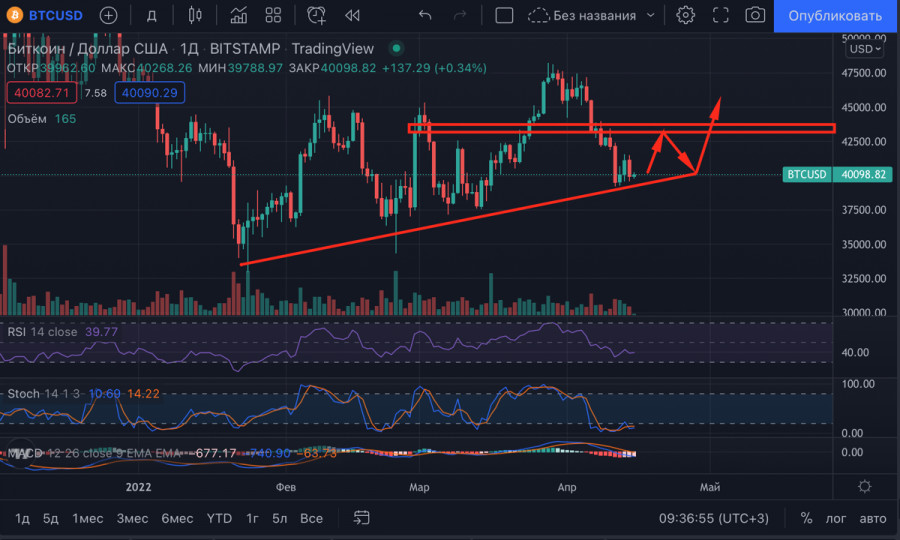
Despite the complexity and pessimism of the situation, let's first consider a positive scenario for the BTC/USD pair. If institutional investors are supported by increased activity of buyers, the price may resume upward movement. In that case, the closing of the weekly candle above $43,000 will be a signal to open long positions. This is possible due to pressure from traditional markets and institutional investors. Since more than 18% of BTC investors are retail traders, there is every reason to believe that Bitcoin will manage to resume its uptrend.
Let's consider the pessimistic scenarios, which look more likely to occur. The cryptocurrency withstood the fourth attempt to break through support at $40,000 in the fourth day. Nobody canceled the rule that the more often the price tests the zone, the more probable its future breakthrough. Therefore, it is quite probable that after trading above $40,000, we may see a local rebound to the area of $41,000-$42,500, where the 7 EMA and the Fibo level of 0.382 are located. Subsequently, the price will start to decline again due to dominating sellers' positions and passive accumulation by large investors. The price may drop to $35,000.
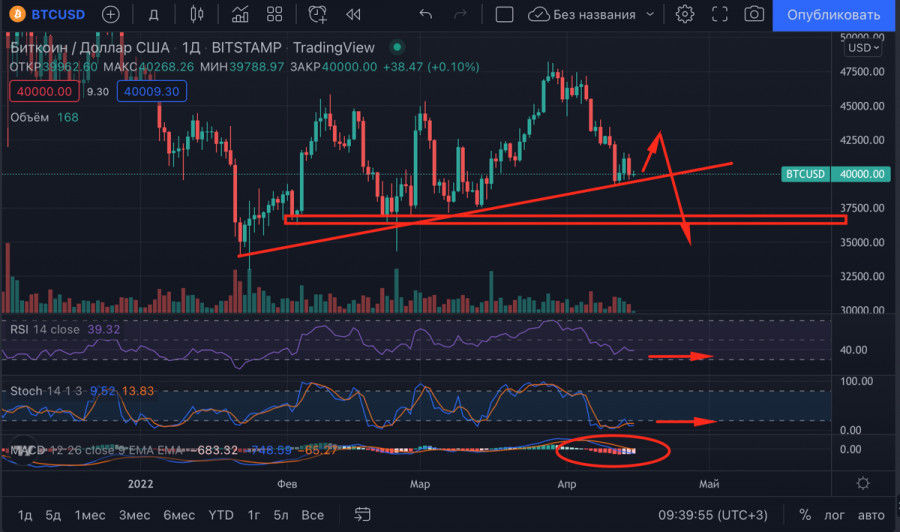
The second scenario could be positive, as it implies a rebound to $43,000. If bulls become more active, there will be a chance to consolidate above $43,000 and continue the upward movement towards the range of $44,000-$45,000. But in that case, the price has to break the 365 EMA and the strong 0.5 Fibo resistance level. Given the current state of the market and the fear of declining liquidity, the price will make a reversal near $43,000 and will start to decline to the range of $35,000-$36,000. Then there is a possibility of premature price recovery if some of the big investors like Luna Foundation want to protect their capital acquired during the last month. However, given the political and economic instability, it doesn't make sense to predict for such a broad period. At the current stage, the flagship cryptocurrency is much closer to a bearish price movement scenario due to the continued migration of capital by investors.
Trading analysis offered by RobotFX and Flex EA.
Source #RobotFX Team
Comments
Post a Comment