Technical outlook:
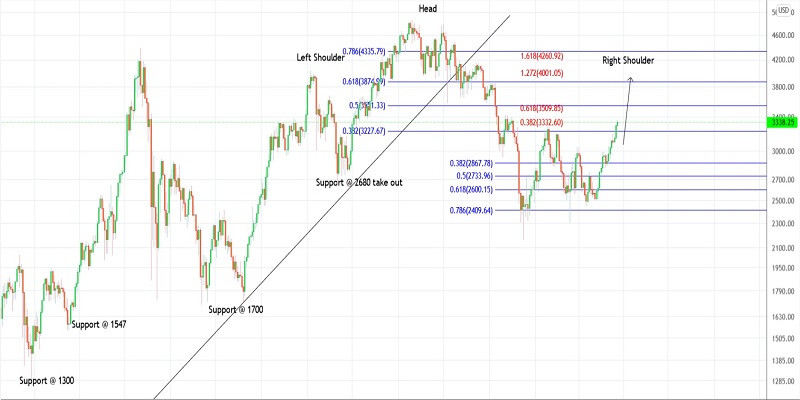
Ethereum has raised through $3,350 levels on Monday, in-line with expectations and projected targets. The crypto has hit the initial target at $3,330 as seen on the daily chart here. The next target could be above the $3,500 mark, which is fibonacci 0.618 extension as seen here. Bulls will be poised to remain in control for now as potential remains through $3,800-4,000 zone.
Ethereum had dropped between $4,850 and $2,100 levels carving a meaningful downswing earlier. The crypto is inching towards its fibonacci 0.618 retracement of the above downswing, which is close to $3,900 mark. High probability remains for bears to be back in control thereafter and drag below the $2,100 lows.
Ethereum is unfolding its corrective rally since $2,100 lows and is probably into the last leg higher. Potential upside targets of the counter trend are converging with the retracement of primary downswing around $3,800-3,900 levels. Potential for a strong bearish reversal remains high if prices manage to reach $3900 mark.
Trading plan:
Potential rally toward $3,800-4,000 against $2,100. Then lower.
Good luck!
Trading analysis offered by RobotFX and Flex EA.
Source #RobotFX Team
Comments
Post a Comment