The price of gold appears to have reversed ahead of the 50-Day SMA ($1888) as it extends the advance from the monthly low ($1895), and fresh data prints coming out of the US may fuel the recent advance in the precious metal as the Federal Reserve’s preferred gauge for inflation is expected to increase for the sixth consecutive month.
The price of gold appears to be on track to retrace the decline from the yearly high ($2070) as it breaks out of the range bound price action following the Federal Open Market Committee (FOMC) interest rate decision, and the update to the US Personal Consumption Expenditure (PCE) Price Index may prop up the precious metal as the reading core reading is expected to increase to 5.5% from 5.2% per annum in January.
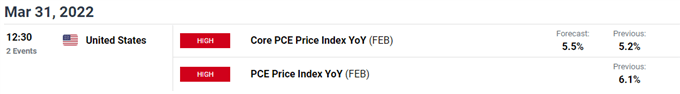
Another uptick in the core PCE may put pressure on the FOMC to normalize monetary policy at a faster pace as the gauge climbs to its highest reading since 1983, and it remains to be seen if the central bank will adjust its exit strategy at the next rate decision on May 4 as Chairman Jerome Powell acknowledges that the committee could “move more aggressively by raising the federal funds rate by more than 25 basis points.”
Until then, evidence of heightening price pressures may keep the price of gold afloat even as the FOMC looks to winddown its balance sheet later this year, and bullion may stage a larger advance over the coming days as market participants hedge against inflation,
With that said, the price of gold may continue to retrace the decline from the yearly high ($2070) as the Fed’s preferred gauge for inflation is expected to increase for the sixth consecutive month, and bullion may stage further attempts to test the record high ($2075) as it reverses course ahead of the 50-Day SMA ($1888).
Follow me on Twitter at @DavidJSong
Trading analysis offered by RobotFX and Flex EA.
Source #RobotFX Team
Comments
Post a Comment