Gold plunged after reaching 1,974.48. It was traded at 1,898.64 at the time of writing. XAU/USD dropped by 4.05% from today's high of 1,974.48 to 1,894.48 daily low. Surprisingly or not, the yellow metal plunged despite the risk-off sentiment dominating the markets. Still, the sell-off could be only a temporary one.
As you already know, the geopolitical tensions escalate, that's why the XAU/USD rallied in the last weeks. DXY's strong rally forced the price of gold to slip lower. At the time of writing, the Dollar Index retreated but the bias remains bullish.
XAU/USD amazing sell-off
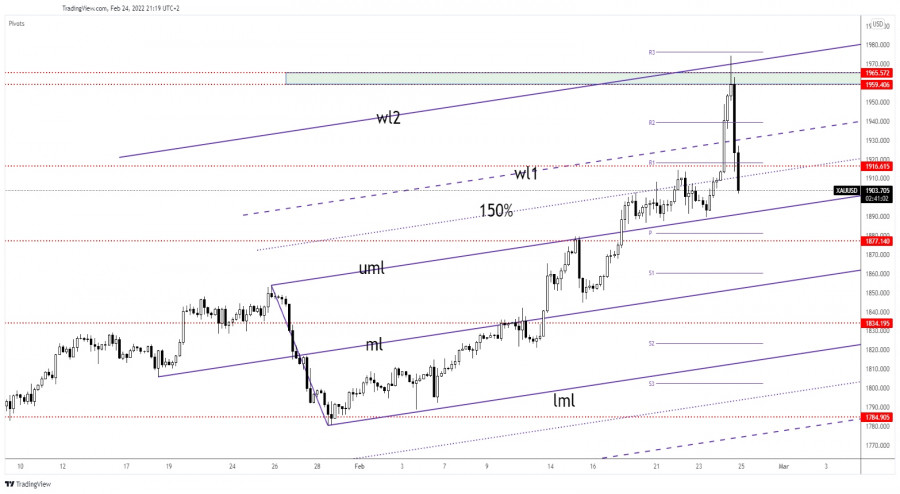
As you can see on the H4 chart, XAU/USD found resistance at 1,959.40 - 1,965.57 zone. It has registered only a false breakout above it. Now, it has ignored the immediate downside obstacles.
The ascending pitchfork's upper median line (uml) and the level of 1,877.14 could represent strong downside obstacles. It remains to see how it will react around these levels.
XAU/USD prediction
Technically, a corrective phase was somehow expected after a strong rally. I have to admit that I didn't expect such a heavy drop. Gold could test and retest strong demand levels before starting to grow.
Staying above 1,877 static support, registering only false breakdowns below the weekly pivot point of 1,881.35 could announce that the sell-off could be over. Also, failing to stay below the psychological level of 1,900 could signal that the sellers are exhausted. False breakdowns with great separation or major bullish patterns could bring new long opportunities.
Trading analysis offered by RobotFX and Flex EA.
Source #RobotFX Team
Comments
Post a Comment